Fluid Power Shipments Drop in July
Fluid power shipments fell in July, according to the latest data from the National Fluid Power Association. Raw index data shows that pneumatic, mobile hydraulic, and industrial hydraulic shipments all decreased in July when compared to June. But the 12-month moving average of shipments for hydraulics and total fluid power continues to grow, while pneumatics is approaching a plateau. The year-to-date percent change for total fluid power shipments in July is 15.2%. The figures are from
NFPA’s Confidential Shipment Statistics (CSS) program.
Hydraulic and Pneumatic Shipments
Raw Index Data, Index: 2018=100
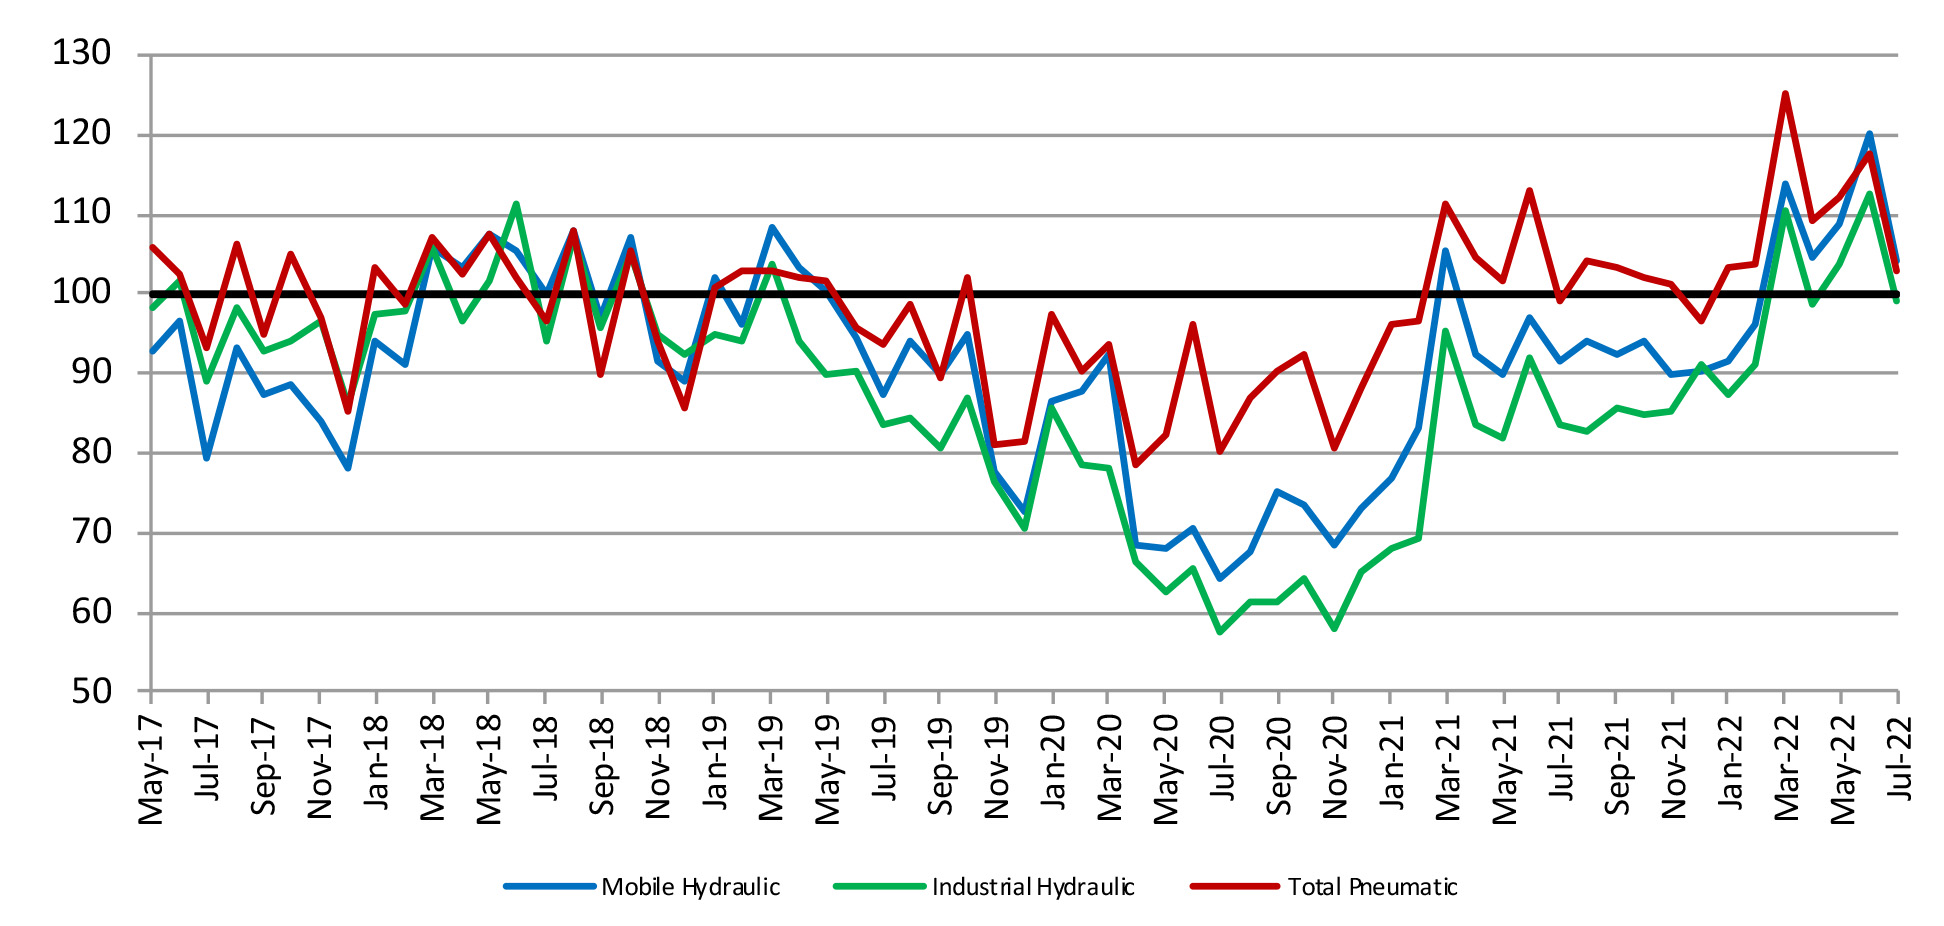
This graph of raw index data is generated by the total dollar volume reported to NFPA by CSS participants and compared to the average monthly dollar volume in 2018. For example, the July 2022 total dollar volume for pneumatic shipments is 103.0% of the average monthly dollar volume in 2018. (Base Year 2018 = 100)
| Shipments | Month | Total Fluid Power | Total Hyd. | Total Pneu. |
|---|---|---|---|
| May 2022 | 14.9 | 17.0 | 8.4 |
| June 2022 | 15.5 | 18.2 | 7.6 |
| July 2022* | 15.2 | 17.8 | 7.1 |
| *Preliminary data subject to revision | |||
Shipments – Cumulative year‐to‐date % change (2022 vs. 2021)
The table above is expressed in terms of cumulative percent changes. These changes refer to the percent difference between the relevant cumulative total for 2022 and the total for the same months in 2021. For example, July 2022 pneumatic shipments figure of 7.1 means that for the calendar year through July 2022, pneumatic shipments increased 7.1% compared to the same time-period in 2021.
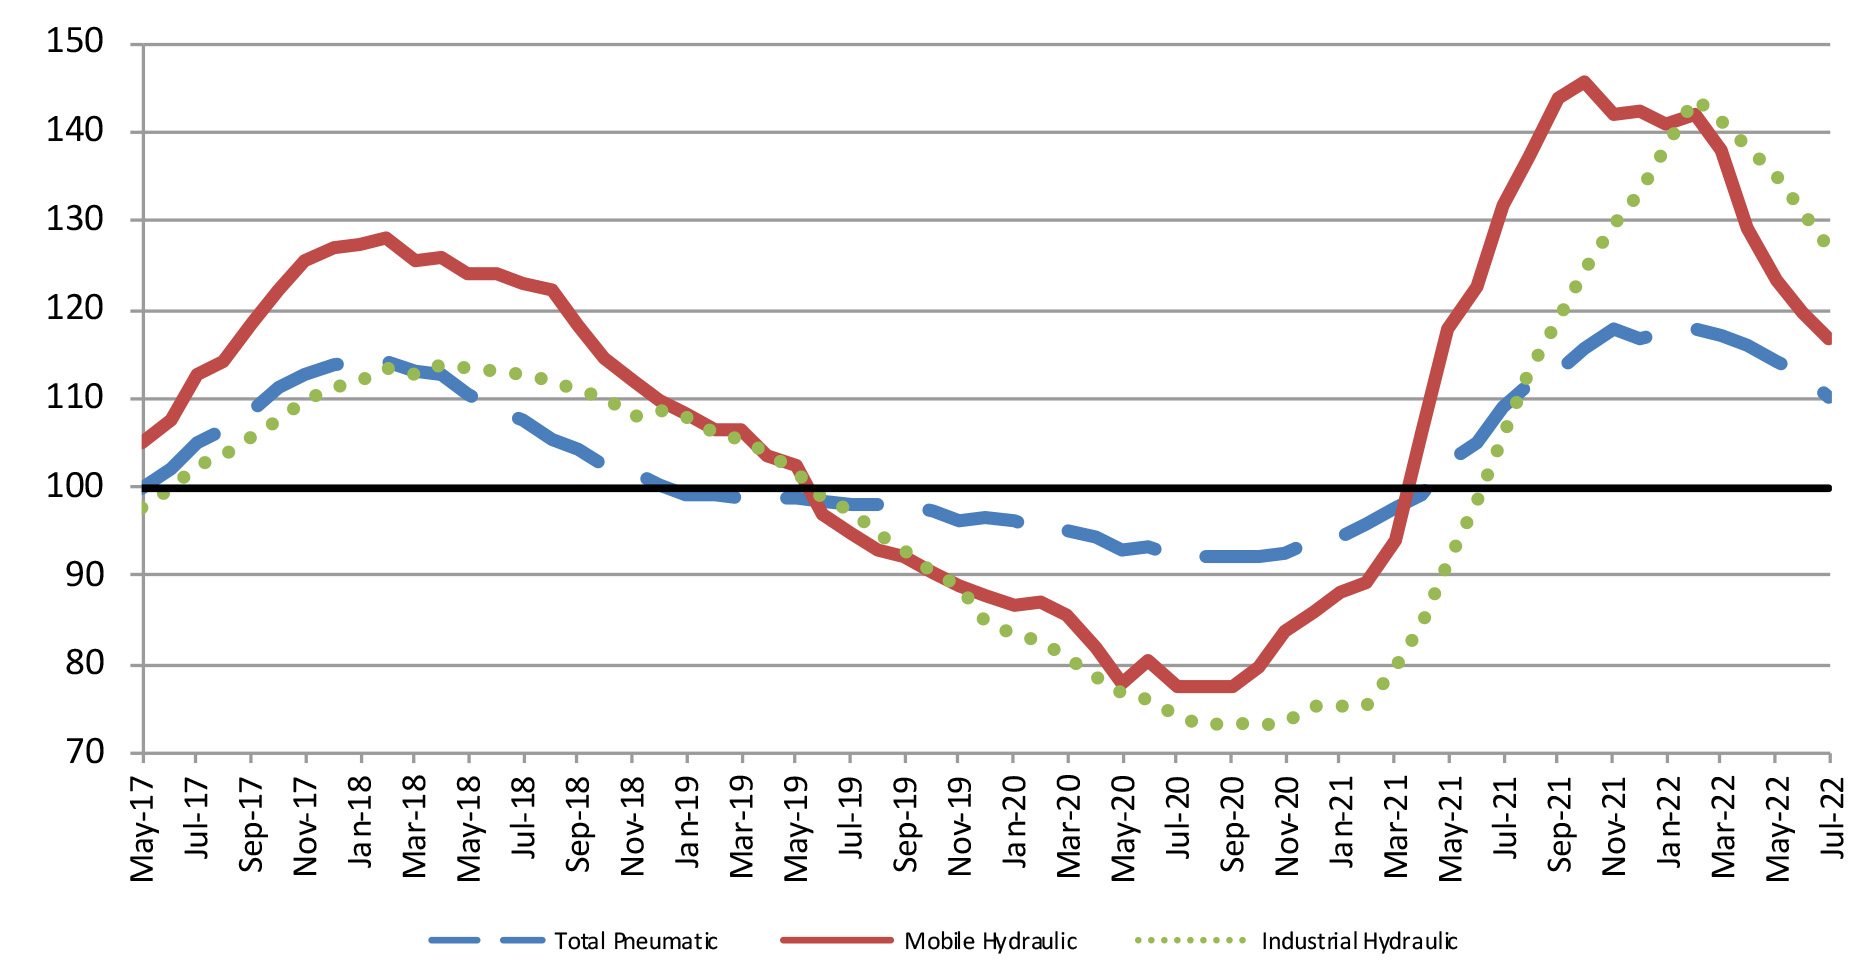
Pneumatic, Mobile and Industrial Hydraulic Orders 12/12 Ratio
Each point on this graph represents the most recent 12 months of orders compared to the previous 12 months of orders. Each point can be read as a percentage. For example, 126.8 (the July 2022 level of the industrial hydraulic series) indicates that industrial hydraulic orders received from August 2021 to July 2022 were 126.8% of the orders received from August 2020 to July 2021. (Base Year 2018 = 100)
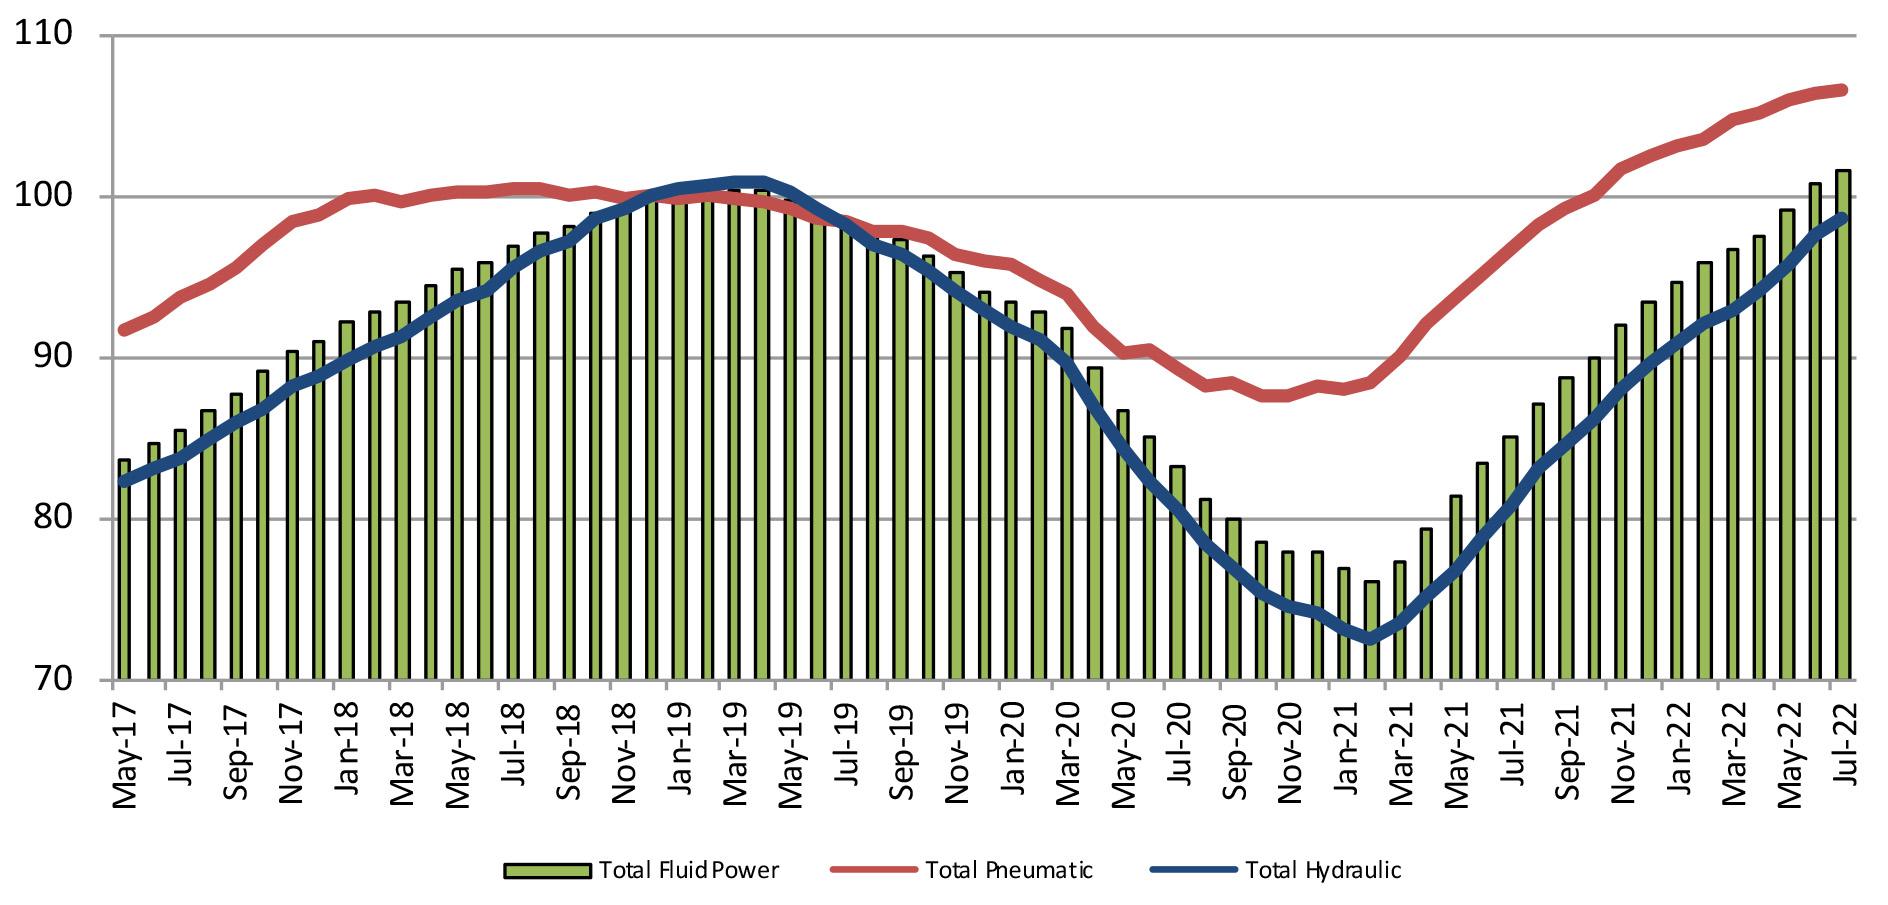
Total ‐ Hydraulic and Pneumatic Shipments 12 Month Moving Average
This graph of 12-month moving averages shows that in July 2022, the moving averages for total fluid power and total hydraulic increased while pneumatic appears to be approaching a plateau. (Base Year 2018 = 100)
Share this information.
Related Posts


Sponsor
Sponsors