Fluid Power Industry Growth Trend
Data published by the National Fluid Power Association shows the 12 month moving average of shipments for pneumatics, hydraulics, and total fluid power continues to grow. The year-to-date % change for shipments in May 2023 is 10.7%. Mobile hydraulic orders received from June 2022 to May 2023 are currently 95.8% of the orders received from June 2021 to May 2022. When looking at raw index data, pneumatic, mobile hydraulic, and industrial hydraulic shipments increased when compared to last month. These charts are drawn from data collected from over 70 manufacturers of fluid power products by NFPA’s Confidential Shipment Statistics (CSS) program.
Hydraulic and Pneumatic Shipments
Raw Index Data, Index: 2018=100
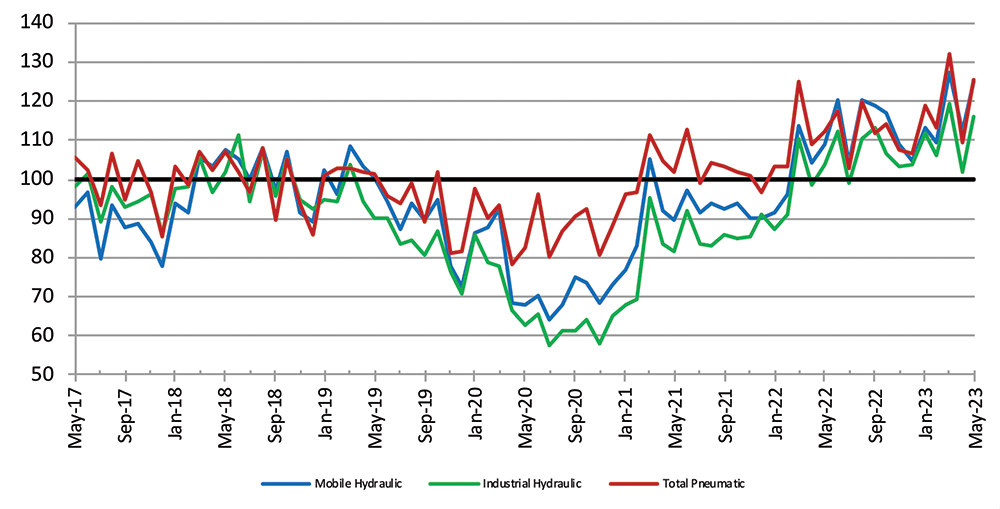
This graph of raw index data is generated by the total dollar volume reported to NFPA by CSS participants and compared to the average monthly dollar volume in 2018. For example, the May 2023 total dollar volume for pneumatic shipments is 125.4% of the average monthly dollar volume in 2018. (Base Year 2018 = 100)
Pneumatic, Mobile, and Industrial Hydraulic Orders 12/12 Ratio
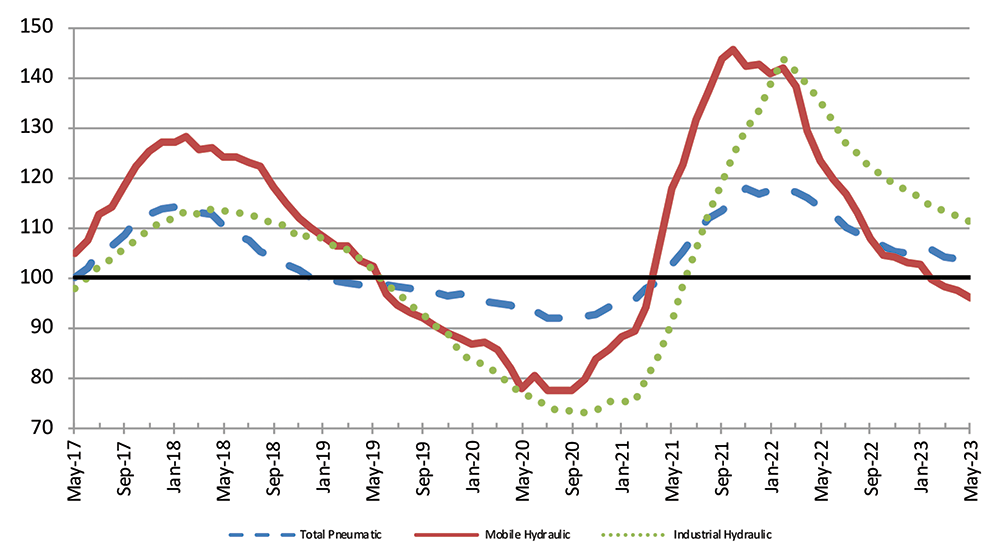
Each point on this graph represents the most recent 12 months of orders compared to the previous 12 months of orders. Each point can be read as a percentage. For example, 111.2 (the May 2023 level of the industrial hydraulic series) indicates that industrial hydraulic orders received from June 2022 to May 2023 were 111.2% of the orders received from June 2021 to May 2022. (Base Year 2018 = 100)
Total – Hydraulic and Pneumatic Shipments 12 Month Moving Average
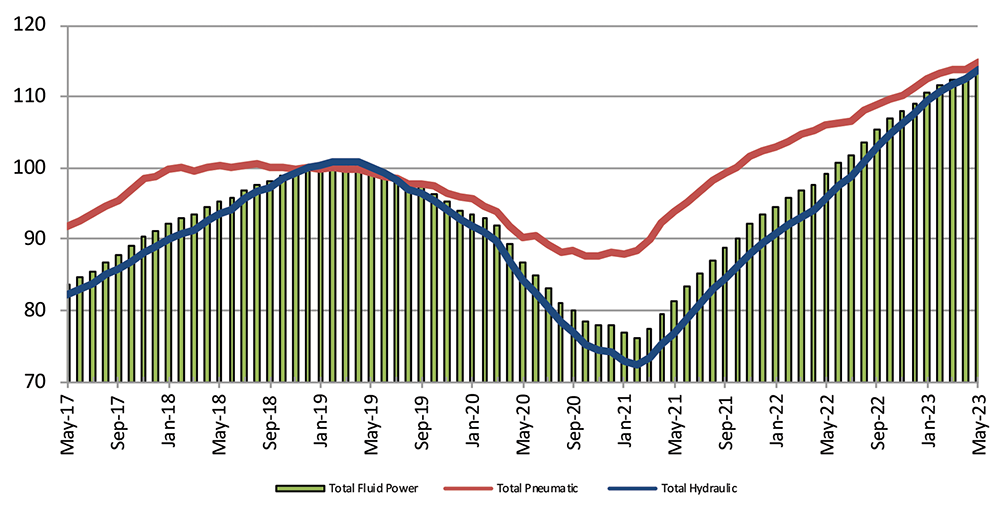
Each point in this graph represents the average index for the 12 most recent months of shipments. Moving averages help clearly identify trends. The latest data shows total fluid power, total pneumatic, and total hydraulic shipment indexes continue to grow. (Base Year 2018 = 100)
Shipments – Cumulative year‐to‐date % change (2023 vs. 2022)
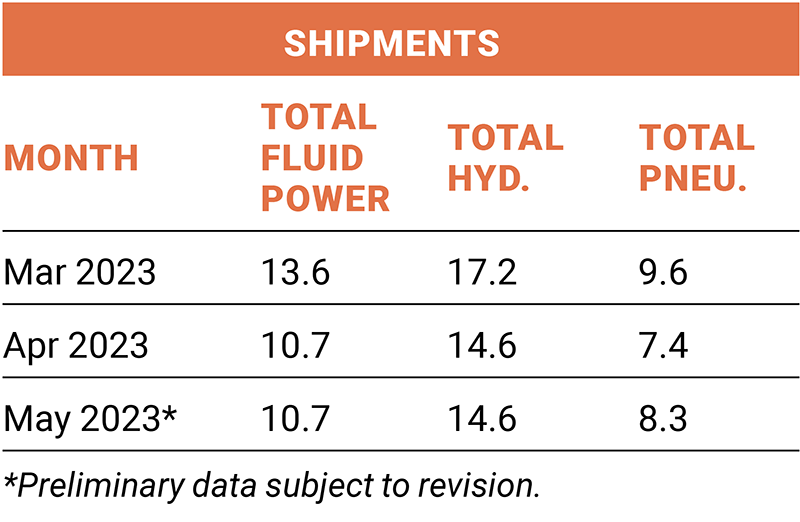
The table above is expressed in terms of cumulative percent changes. These changes refer to the percent difference between the relevant cumulative total for 2023 and the total for the same months in 2022. For example, May 2023 pneumatic shipments figure of 8.3 means that for the calendar year through May 2023, pneumatic shipments increased 8.3% compared to the same time-period in 2022.
Share this information.
Related Posts


Sponsor
Sponsors