Growth Continues in February Shipments
The latest data published by the National Fluid Power Association shows the 12-month moving average of shipments for pneumatics, hydraulics, and total fluid power continue to grow. The year-to-date % change for total fluid power shipments in February 2023 is 16.8%. Mobile hydraulic orders received from March 2022 to February 2023 are currently 99.6% of the orders received from March 2021 to February 2022. When looking at raw index data, pneumatic, mobile hydraulic, and industrial hydraulic shipments decreased when compared to last month.
Hydraulic and Pneumatic Shipments
Raw Index Data, Index: 2018=100
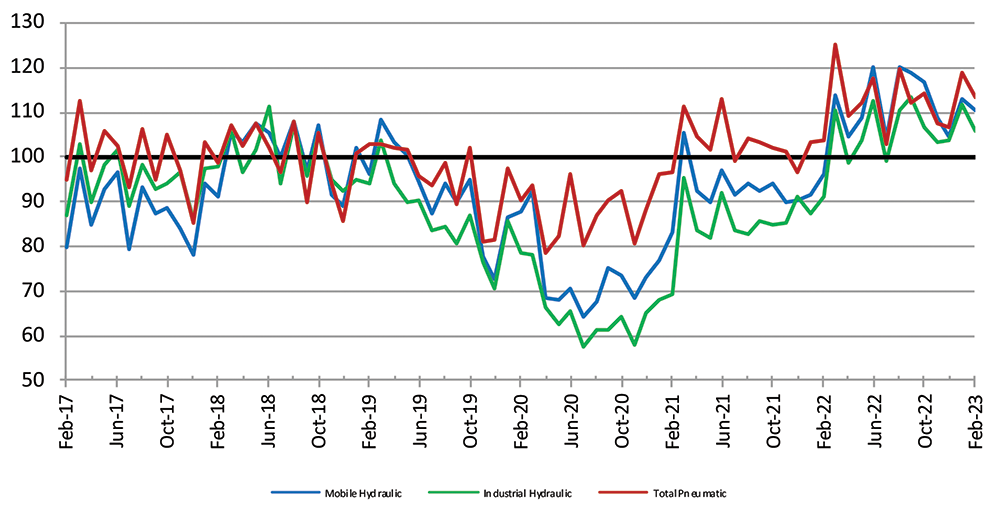
This graph of raw index data is generated by the total dollar volume reported to NFPA by CSS participants and compared to the average monthly dollar volume in 2018. For example, the February 2023 total dollar volume for pneumatic shipments is 113.2% of the average monthly dollar volume in 2018. (Base Year 2018 = 100)
Pneumatic, Mobile, and Industrial Hydraulic Orders 12/12 Ratio
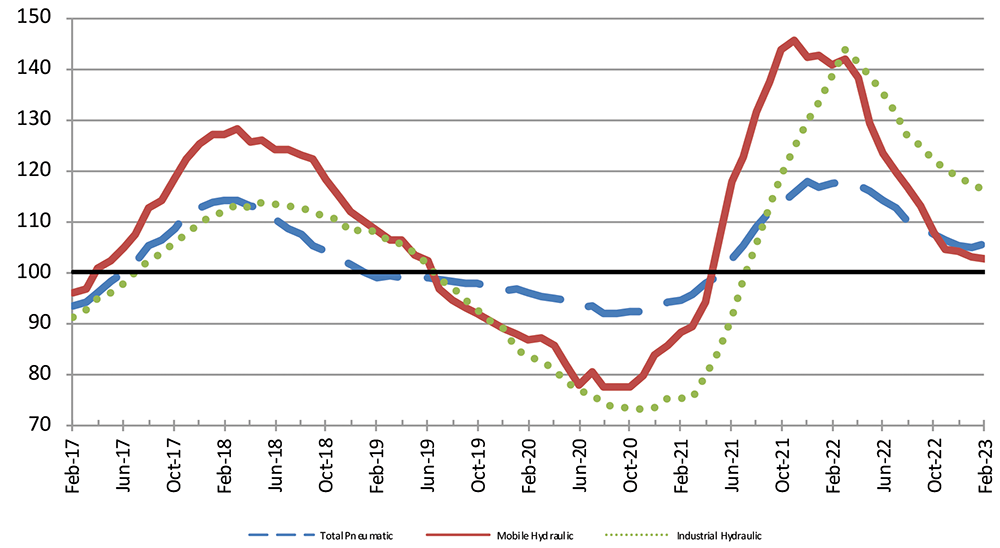
Each point on this graph represents the most recent 12 months of orders compared to the previous 12 months of orders. Each point can be read as a percentage. For example, 114.1 (the February 2023 level of the industrial hydraulic series) indicates that industrial hydraulic orders received from March 2022 to February 2023 were 114.1% of the orders received from March 2021 to February 2022. (Base Year 2018 = 100)
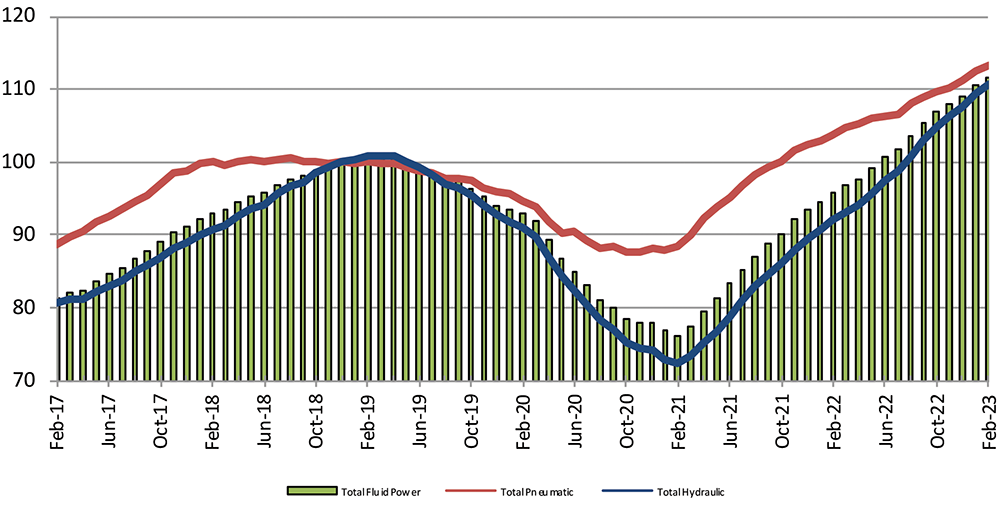
This graph of 12-month moving averages shows that in February 2023, total fluid power, total pneumatic, and total hydraulic all increased.
(Base Year 2018 = 100)
Shipments – Cumulative year‐to‐date % change (2023 vs. 2022)
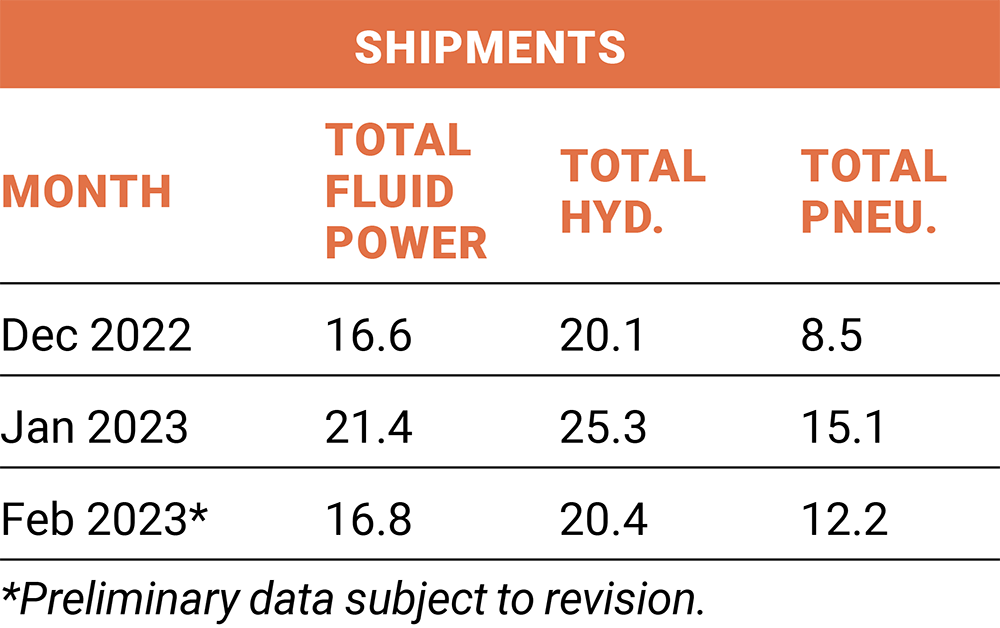
The table above is expressed in terms of cumulative percent changes. These changes refer to the percent difference between the relevant cumulative total for 2023 and the total for the same months in 2022. For example, February 2023 pneumatic shipments figure of 12.2 means that for the calendar year through February 2023, pneumatic shipments increased 12.2% compared to the same time-period in 2022.
Share this information.
Related Posts

Fluid Power Shipments Increase – March 2021 Industry Growth Trends
Webtec Technician’s Guide Available on Kindle
Follow-Up: Properly Installing JIC Hydraulic Fittings

Endress+Hauser Launches Temperature Transmitter with Bluetooth
PACK EXPO Names Technology Award Finalists

Notable Words: Hydraulics & Electrification – The Future Is Bright
Sponsor
Sponsors