Integration of Ferrous Density and Particle Count for Automated Ferrography Analysis of Abnormal Wear Conditions
By D. Walsh, K. Caldwell, and T. Barraclough, Ametek Spectro Scientific, Inc.
Introduction
The presence of wear debris in machinery lubrication oils is a significant indicator of the condition of machinery health and indicative of equipment failure. Other oil analysis parameters reflect oil condition, contamination, or normal wear. These are sometimes leading indicators of abnormal machinery wear, but measuring wear parameters directly allows trending of the most significant indicators of incipient machinery failure.
The majority of machinery components lubricated are ferrous so trending the ferrous content in oil over time provides evidence of progressive machinery wear. Not all wear is considered equal, however.
Large ferrous wear particles are most indicative of abnormal machinery wear, a sign that the “onset of failure” point of the P-F curve has been reached. It is important to predict when failure is about to occur, and identify transition of wear from small (benign wear) to large (severe wear) particles as a wear surface is broken down. It is very important to remember large particles contribute very little mass (ppm) to the overall concentration in the sample.
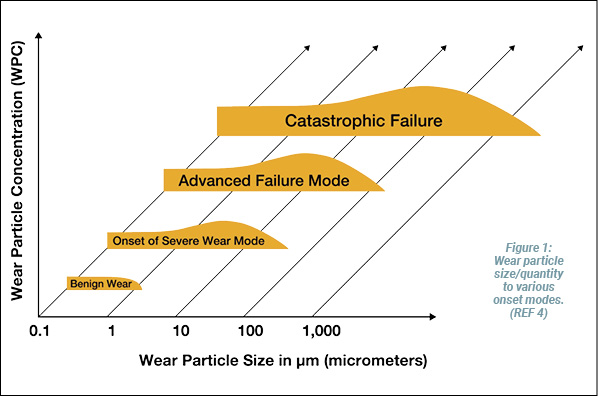
Ferrography was introduced in the 1970s to enable condition monitoring practitioners to augment elemental spectroscopy techniques to quantify the level of normal and abnormal wear present in an oil sample. Iron wear was, and remains, the most common elemental wear found in samples of machinery oil worldwide. Analytical Ferrography, where a skilled diagnostician familiar with wear particle morphology, microscopically examines separated wear debris on a glass slide or a filter patch, remains a very informative and powerful test. ASTM D7690, introduced a few years ago, describes the method in detail. The time to prepare a ferrogram slide (15 minutes) coupled with a skilled examination (20 minutes) is too long in terms of turnaround time for both laboratories or onsite programs to recommend all samples to have the test, notwithstanding the cost, which can be over $300 per test.
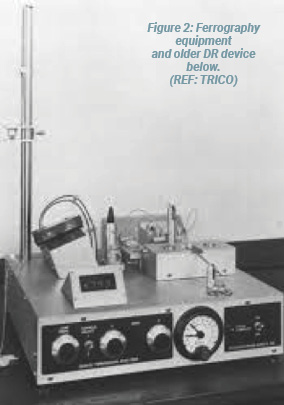 Ferrous density meters have been in the marketplace for some time, and all of them employ a slightly different aspect of traditional electromagnetism theory to take advantage of a change in electrical signal when a ferromagnetic metallic particle is sensed. Changes in magnetic flux, dielectric constant, and magnetic inductance or capacitance techniques have all been used in prior systems. The simplicity is use, without fluid opacity interferences of DR ferrography allowed them to become the primary tool most analytical labs have recommended for total wear screening, with the dimensionless output was a scalar representation of ferrous material present, without detail to the size of the particles—not the most sensitive trigger for analytical ferrography.
The Challenge
It is now well understood that onsite analysis provides the highest quality data if tested with lab grade technologies. As more equipment owners consider adopting the technology locally, replicating a laboratory environment, especially for ferrous wear debris analysis, is considered to be too complicated. Laboratories use elemental spectroscopy, optical particle counters, DR or ferrous density meters, and analytical ferrography to diagnose a severe wear situation in industrial machinery. The data is generated discretely, and takes up to 35 minutes to arrive at diagnostics from 3 sets of data from 3 discrete devices.
The Solution
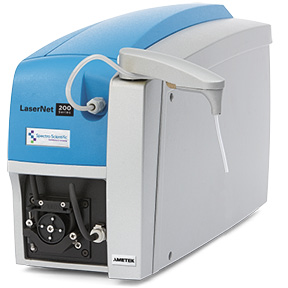 The LaserNet fine particle counter and image classifier is based on an innovative direct imager approach developed by the U.S. Naval Research Laboratory. The product was adapted by several condition monitoring laboratories and end-users, and the technology remains a standard product offering. In looking to provide ferrous information to shape based particle counts continuous model updates in 2017 to the LNF particle counter classifier result today in a ferrous debris monitor in series with the particle count, that only take 5 minutes to run, without dilution for oil less than 320Cst @ 40C. Dilution is employed for time savings above that value.
This magnetic susceptibility is then correlated to the concentration of ferrous debris in the lubricant by means of the known magnetic susceptibility of such debris. The new approach takes advantage of an innovative coil arrangement (Fig. 3), complete with advanced electronics to provide a very sensitive monitor for particles ranging from sub ppm to % concentration in under a minute.
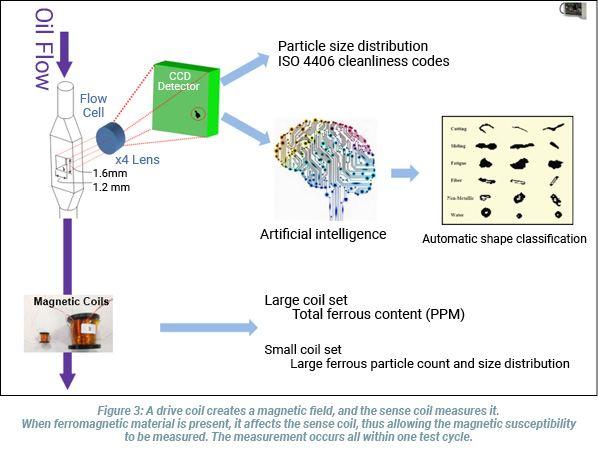
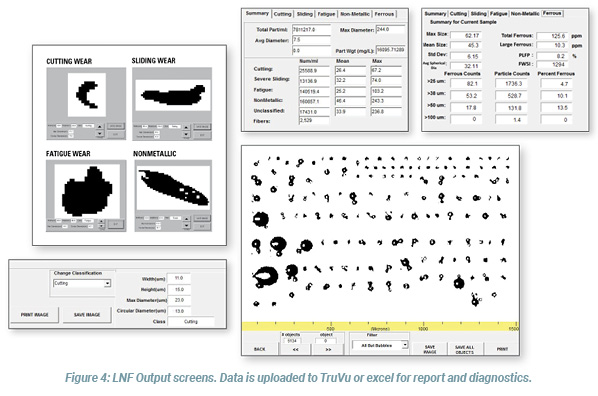
Parameters are available based upon the calibrated measurements of the LaserNet ferrous monitor. The signals from the small magnetometer coil set which comprise the large ferrous particle counts (Fe>25u) are converted to report a single large ferrous parameter in addition to the individual counts. This “Large Ferrous” parameter is a calibrated ppm measurement of all ferrous particles > 25um. Combined with the “Total Ferrous” measurement of the large magnetometer coil set also reported in ppm, we now have units of measurement that allow presentation of NIST traceable indices that can be trended and interpreted in a meaningful way.
Ferrous parameters are derived from these two measurements similar to DR Ferrography:
Percentage large ferrous particle (PLFP) = Large Fe/Total Fe
Ferrous Wear Severity index (FWSI) = Large Fe *Total Fe
Wear Particle Concentration (WPC) = Total Fe
- The magnetometers are calibrated to NIST traceable standards so the LaserNet ferrous wear parameters are more accurate due to the accuracy and precision of the sensing coils compared to the DR Ferrography technology.
- The LaserNet threshold for Large Ferrous is 25 microns, more representative of an abnormal wear condition than the nominal 5 micron DL.
Case Study: Hydraulic System Comparison
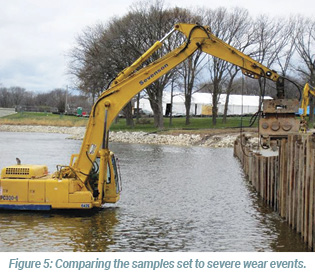
A series of mobile hydraulic system samples were analyzed using the magnetometer option when performing a particle count. There were no trends, simply a comparison of large ferrous wear to total ferrous wear and compared.
In cases where no large ferrous was found, and only total ferrous debris, the wear was predominantly normal rubbing wear. In cases where the large ferrous wear result was greater than total ferrous, the early onset of severe wear was observed. Having the information with wear debris maps provides the onsite user with a significant set of trendable values that are very sensitive to the onset of abnormal wear.
Dakar Rally Engine Failure
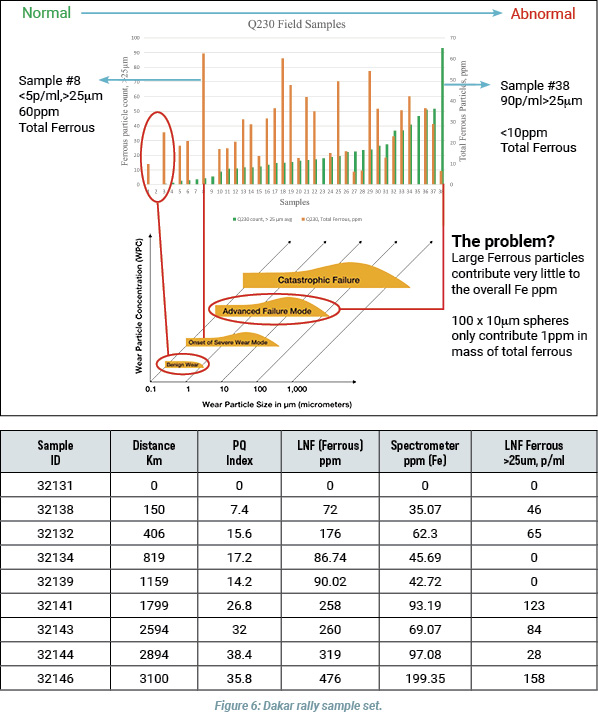
A Dakar rally vehicle was sampled in the field, right through to an engine failure due to a coolant leak. Samples were retained and analyzed, along with RDE/ICP spectroscopy and PQ index ferrous density standalone meter.
Applying Ferrous Wear severity index and % ferrous large particle evaluation show that samples drawn at 150, 2,594, 1,799, and 3,100 km had the highest ferrous wear severity indexes. The engine failed at the 3,100 km mark, however the data suggests that if the engine was inspected at the 1,799 km point, it may have avoided failure at 3,100 km. Even though the PQ and spectrometer data did register a trend increase, the increase would not be at the order of magnitude the ferrous wear provides. Having the ability to provide the data immediately onsite and compare to established alarms can provide the critical data at the point of repair opportunity.
Summary
With the additional ferrous data being provided real time with particle count and shape classification, it is now possible to provide guidance to common wear onset events.
End-users monitoring equipment at equipment site locations now have sophisticated data to enable early warning of abnormal wear events without having to wait for external services.
REFERENCES
[1] Hunt, T.M., Handbook of Wear Debris Analysis and Particle Detection in Liquids, Elsevier Press, 1993, pp148-153
[2] Michaels, P., Barraclough, T., “Detection of Abnormal Wear Particles via Electromagnetic Sensors and Particle Imaging Technologies,” MSOE Research Presentation to STLE Annual Meeting, 2018
[3] Levi, O., Eliaz, N., Failure Analysis and Condition Monitoring of an Open-Loop Oil System Using Ferrography Tribol. Letters (2009) 36:17–29
[5] Poley, J., Complexity in IISTA Fluid analysis, part XXXV, \STLE Tribology & Lubrication technology, Nov 2017, p119



Appreciate your help to provide me with your monthly report
Is there a limitation environment condition to use this product?