Shipments Up in June as Growth Continues
The latest data published by the National Fluid Power Association shows that pneumatic, mobile hydraulic, and industrial hydraulic shipments increased in June when compared to May, according to raw index data. The year-to-date percent change for total fluid power shipments in June was 15.5%. Mobile hydraulic orders received from July 2021 to June 2022 are currently 119.6% of the orders received from July 2020 to June 2021. The following charts are drawn from data collected by NFPA’s Confidential Shipment Statistics (CSS) program.
Hydraulic and Pneumatic Shipments
Raw Index Data, Index: 2018=100
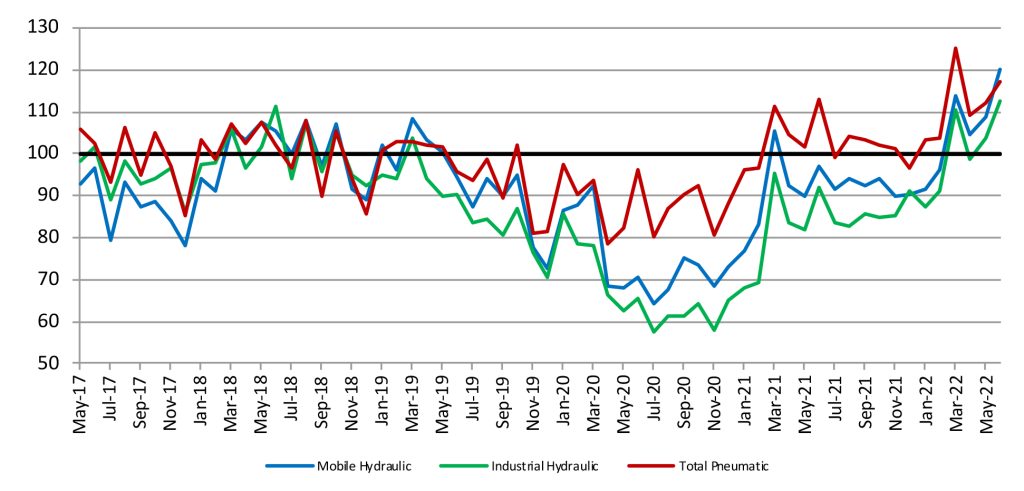
This graph of raw index data is generated by the total dollar volume reported to NFPA by CSS participants and compared to the average monthly dollar volume in 2018. For example, the June 2022 total dollar volume for pneumatic shipments is 117.2% of the average monthly dollar volume in 2018. (Base Year 2018 = 100)
Pneumatic, Mobile and Industrial Hydraulic Orders 12/12 Ratio
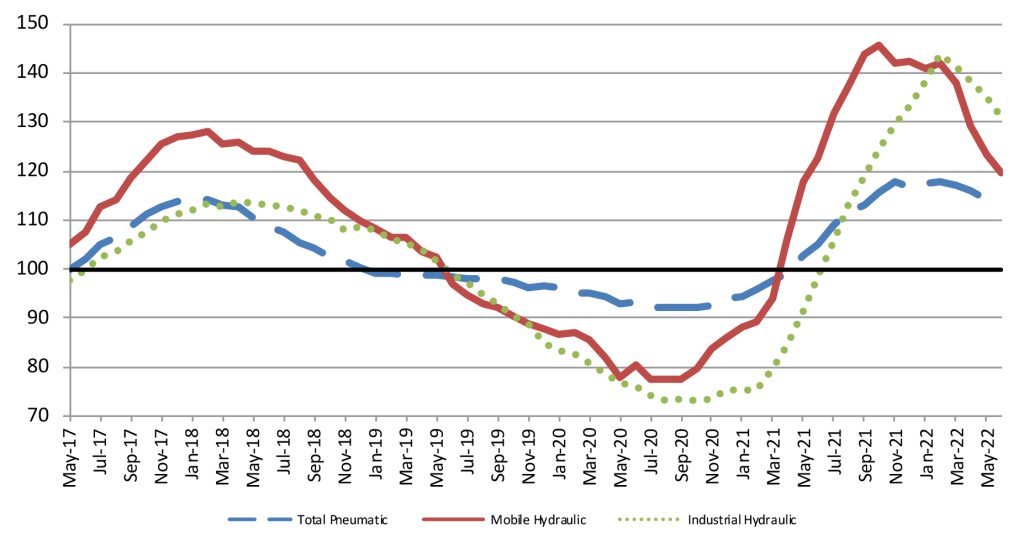
Each point on this graph represents the most recent 12 months of orders compared to the previous 12 months of orders. Each point can be read as a percentage. For example, 131.1 (the June 2022 level of the industrial hydraulic series) indicates that industrial hydraulic orders received from July 2021 to June 2022 were 131.1% of the orders received from July 2020 to June 2021. (Base Year 2018 = 100)
Total ‐ Hydraulic and Pneumatic Shipments 12 Month Moving Average
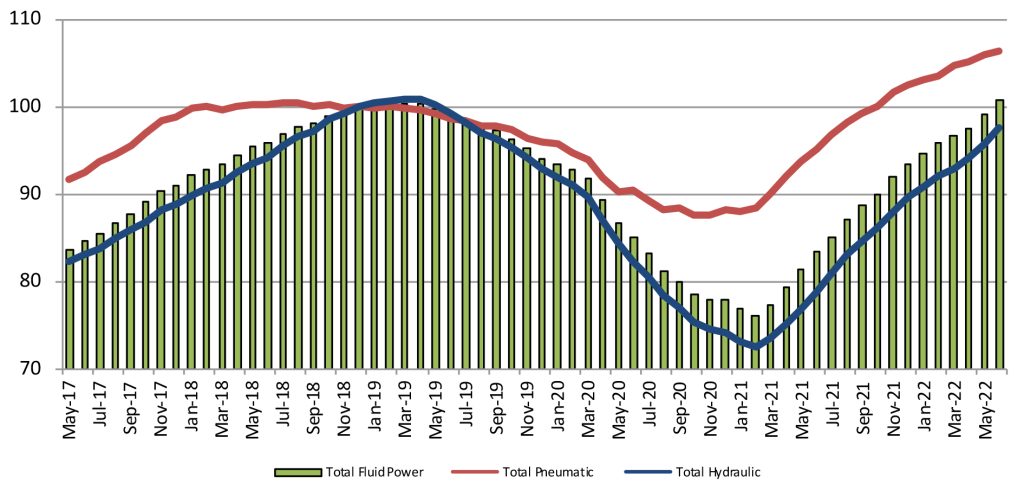
This graph of 12-month moving averages shows that in June 2022, the moving averages for shipments continued to increase across the board. (Base Year 2018 = 100)
Shipments – Cumulative year‐to‐date % change (2022 vs. 2021)
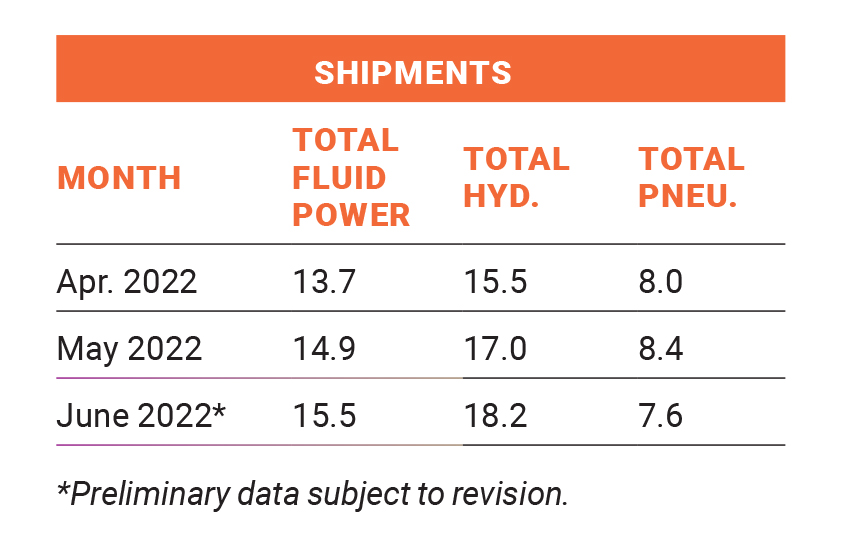
The table above is expressed in terms of cumulative percent changes. These changes refer to the percent difference between the relevant cumulative total for 2022 and the total for the same months in 2021. For example, June 2022 pneumatic shipments figure of 7.6 means that for the calendar year through June 2022, pneumatic shipments increased 7.6% compared to the same time-period in 2021.
Share this information.
Related Posts
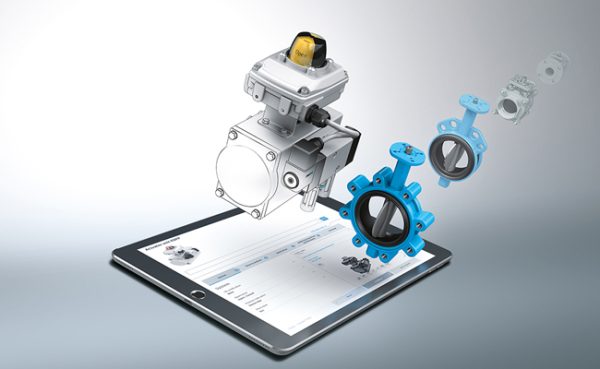
Festo Launches Configurator, Smart Positioner

Case Study: Hundai Drives Ahead with Flexible and Efficient Control Valve Platform
CSS Monthly Shipments: Slow and Steady Growth

NFPA Foundation Awards 11 Fluid Power Research Supplements
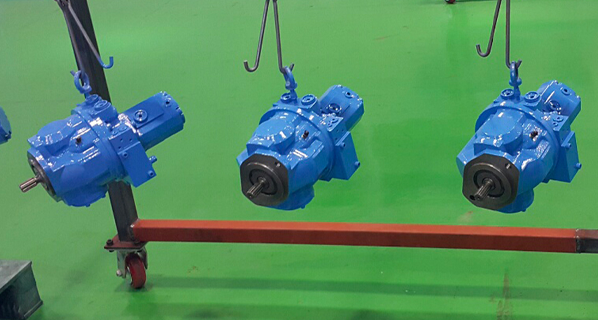
Choosing an Excavator’s Hydraulic Pump

Bosch Rexroth Launches Hägglunds Atom Hydraulic Motor
Sponsor
Sponsors