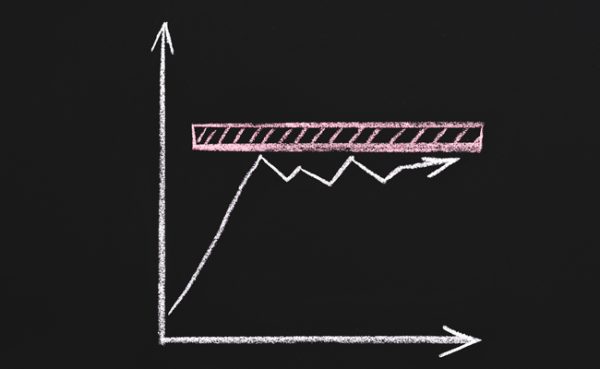
Fluid Power Industry Growth Trend
The latest data published by the National Fluid Power Association shows February 2024 total fluid power shipments falling to -0.7% month over month and decreasing -1.5% year over year. The data and charts above are from NFPA’s Confidential Shipment Statistics (CSS) program where over 70 manufacturers of fluid power products report their monthly orders and shipments. More market information is available to NFPA members, allowing them to better understand trends and anticipate change in fluid power and the many customer markets it serves. Contact NFPA at 414-778-3344 for more info.
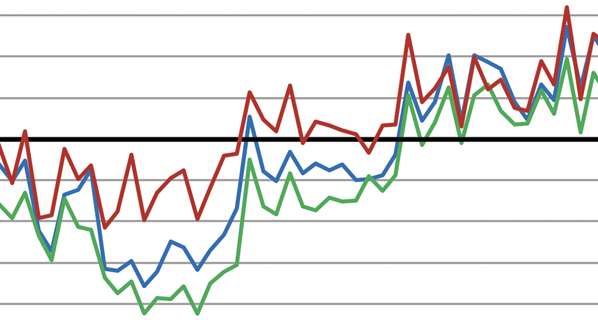
Total Fluid Power Shipments
Index Data: 3 Month Moving Average & 12 Month Moving Average
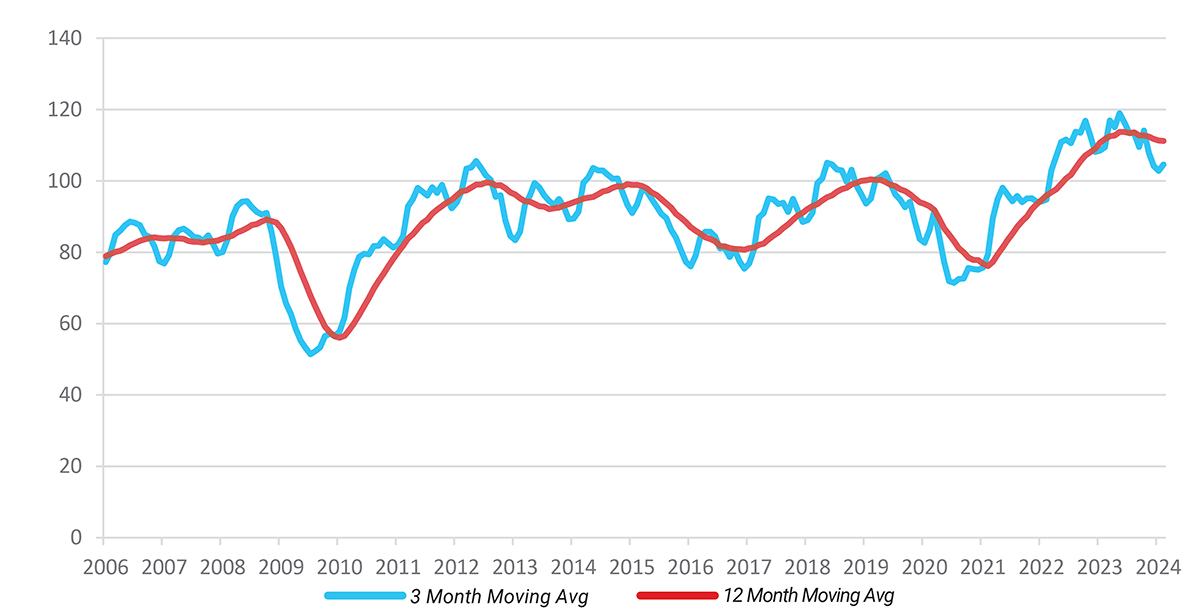
This graph of index data is generated by the total dollar volume reported to NFPA by CSS participants. This graph uses moving averages to smooth out the data and clearly identify trends. (Base Year 2018 = 100).
Shipments: Pneumatic, Mobile Hydraulic, and Industrial Hydraulic
Index Data: 12/12 Rate of Change
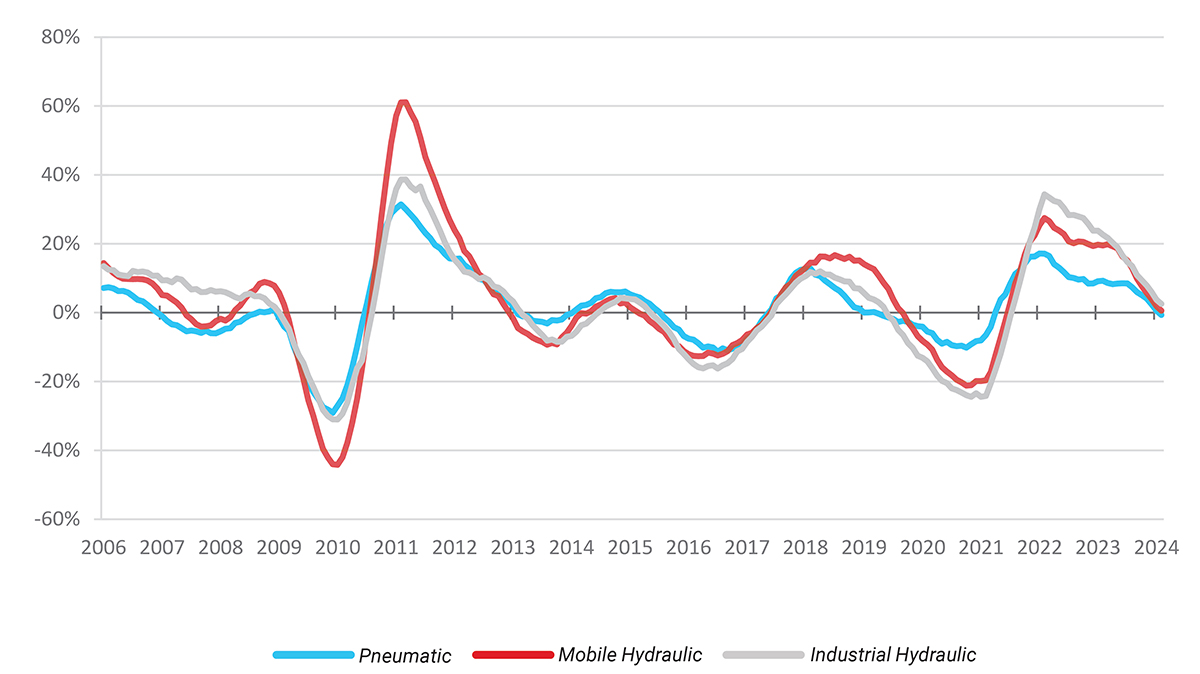
Each point on this graph represents the most recent 12 months of shipments compared to the previous 12 months of shipments. For example, 7.3% (the August 2023 level of the pneumatic series) indicates that the value of pneumatic shipments from September 2022 to August 2023 were 7.3% higher than the value of pneumatic shipments from September 2021 to August 2022.
Orders: Pneumatic, Mobile Hydraulic, and Industrial Hydraulic
Index Data: 12/12 Rate of Change
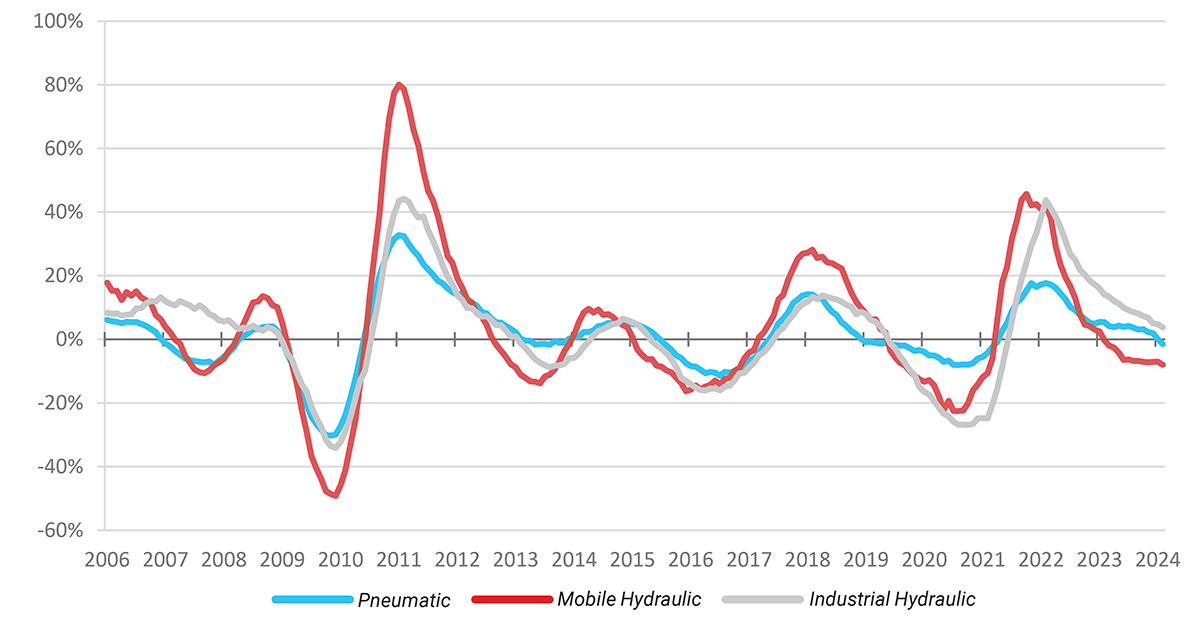
Each point on this graph represents the most recent 12 months of orders compared to the previous 12 months of orders. For example, 8.5% (the August 2023 level of the industrial hydraulic series) indicates that the value of industrial hydraulic orders received from September 2022 to August 2023 were 8.5% higher than the value of industrial hydraulic orders received from September 2021 to August 2022.
*Preliminary data subject to revision.
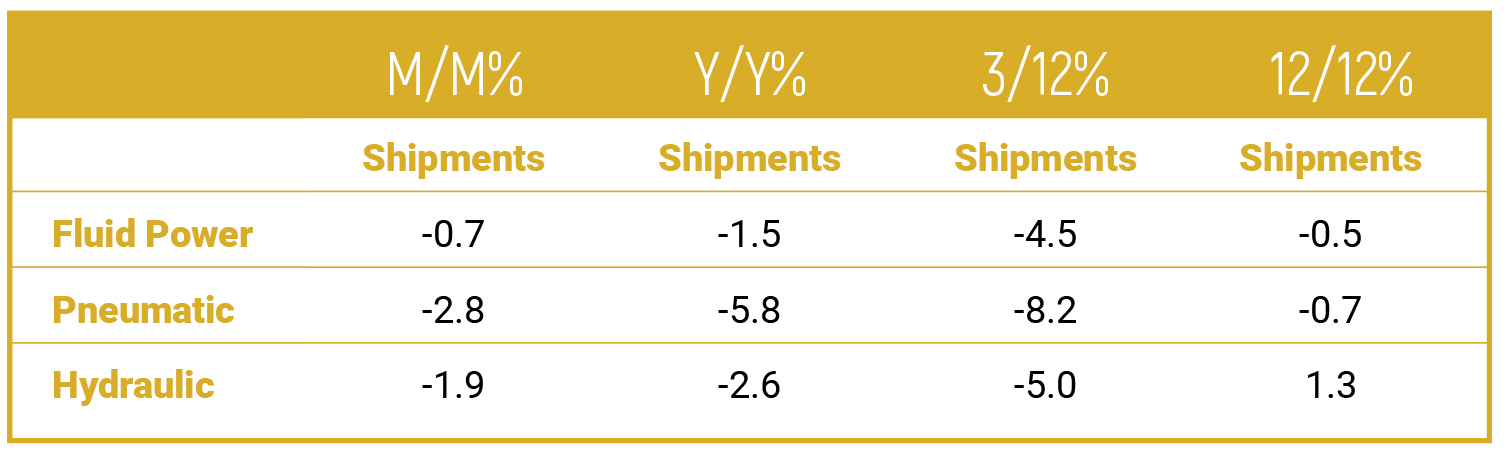
Total Shipments: September 2023
This table shows various rates of change for the month of August 2023. Interpretation for each rate of change calculation:
M/M %: The percent change between the current month and the previous month.
Y/Y %: The percent change between the current month and the same month one year ago.
3/12 %: The percent change between the three most recent months and those same three months one year ago.
12/12 %: The percent change between the twelve most recent months and those same twelve months one year ago.
Share this information.
Related Posts

CTC High Performance Bell-type Suction Cups, the Suction Cups that Hold Fast to Sheet Metal
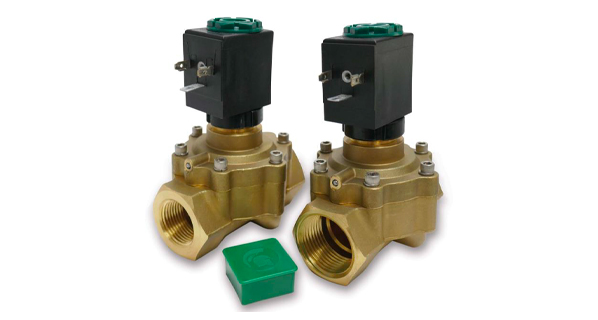
Spartan Scientific Releases Innovative 2-Way Solenoid Valve
Growth Slowing for Fluid Power Products
Fluid Power Industry Growth Trend
NFPA Continues to Strengthen the Fluid Power Industry

AchieVe WDW Series Wide Finger Wire Duct from AutomationDirect
Sponsor
Sponsors