NFPA Reports Continued Growth in March
The latest data published by the National Fluid Power Association shows the 12-month moving average of shipments for pneumatics, hydraulics, and total fluid power continue to grow. The year-to-date % change for total fluid power shipments in February 2023 is 13.6%. Mobile hydraulic orders received from April 2022 to March 2023 are currently 98.0% of the orders received from April 2021 to March 2022. When looking at raw index data, pneumatic, mobile hydraulic, and industrial hydraulic shipments increased when compared to last month. These charts are drawn from data collected from more than 70 manufacturers of fluid power products by NFPA’s Confidential Shipment Statistics (CSS) program.
Hydraulic and Pneumatic Shipments
Raw Index Data, Index: 2018=100
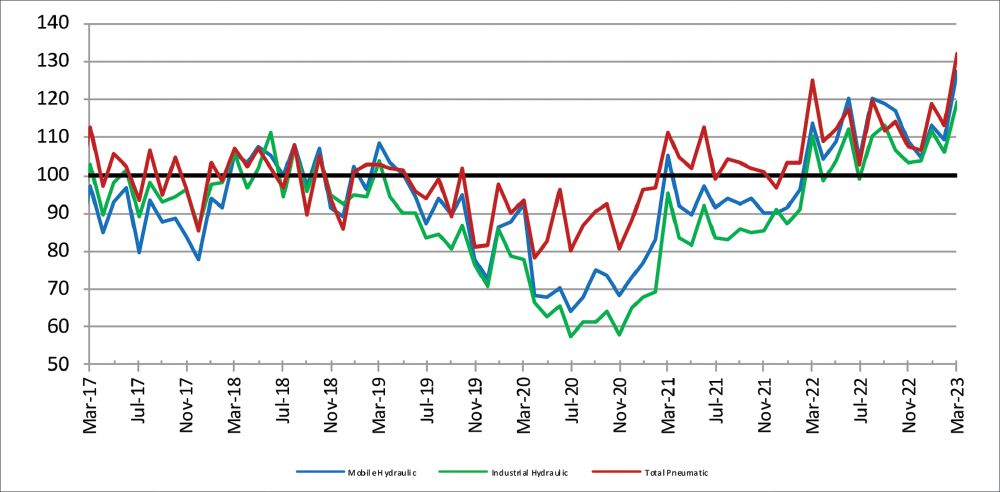
This graph of raw index data is generated by the total dollar volume reported to NFPA by CSS participants and compared to the average monthly dollar volume in 2018. For example, the March 2023 total dollar volume for pneumatic shipments is 132.0% of the average monthly dollar volume in 2018. (Base Year 2018 = 100)
Pneumatic, Mobile, and Industrial Hydraulic Orders 12/12 Ratio
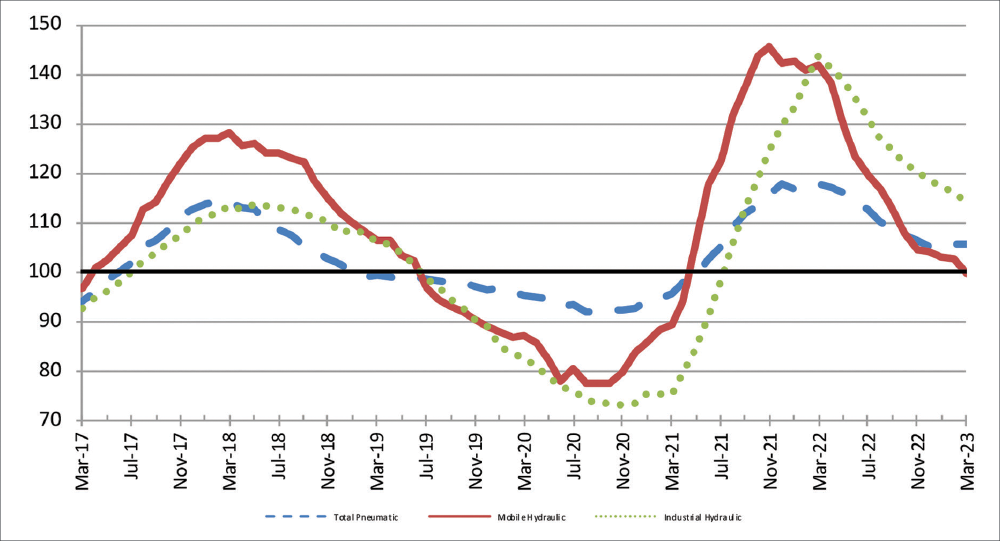
Each point on this graph represents the most recent 12 months of orders compared to the previous 12 months of orders. Each point can be read as a percentage. For example, 113.3 (the March 2023 level of the industrial hydraulic series) indicates that industrial hydraulic orders received from April 2022 to March 2023 were 113.3% of the orders received from April 2021 to March 2022. (Base Year 2018 = 100)
Total – Hydraulic and Pneumatic Shipments 12 Month Moving Average
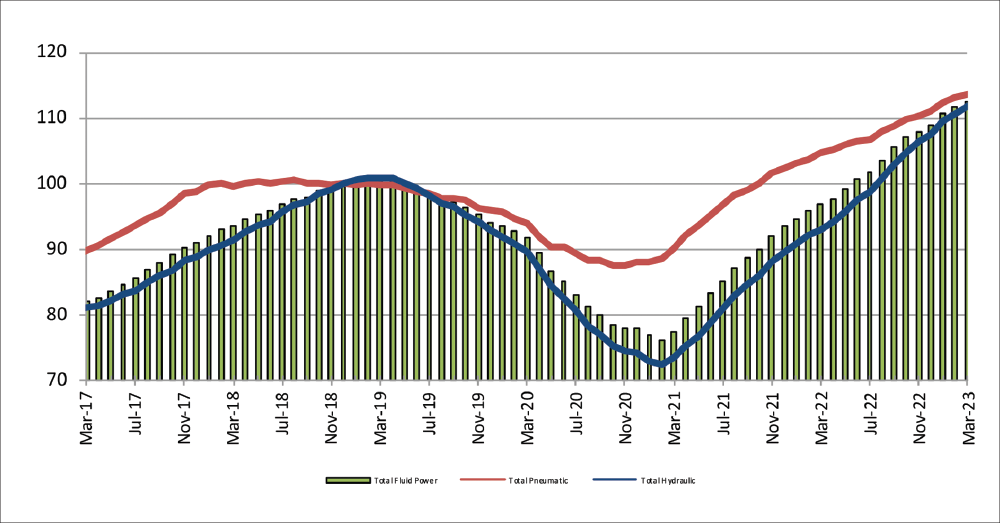
This graph of 12-month moving averages shows that in March 2023, total fluid power, total pneumatic, and total hydraulic all increased. (Base Year 2018 = 100)
Shipments – Cumulative year‐to‐date % change (2023 vs. 2022)
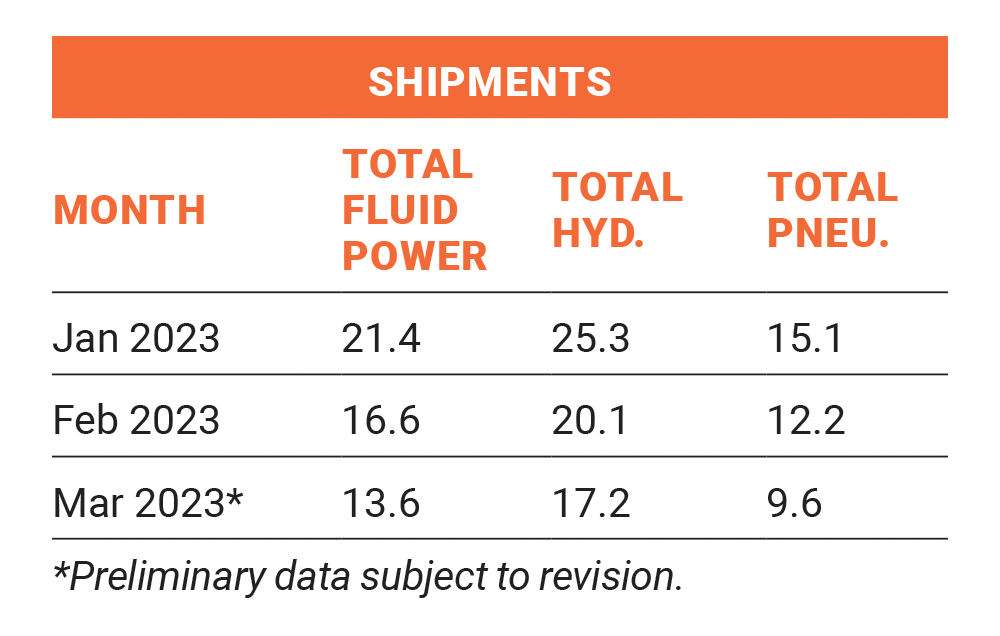
The table above is expressed in terms of cumulative percent changes. These changes refer to the percent difference between the relevant cumulative total for 2023 and the total for the same months in 2022. For example, March 2023 pneumatic shipments figure of 9.6 means that for the calendar year through March 2023, pneumatic shipments increased 9.6% compared to the same time-period in 2022.
Share this information.
Related Posts

Founder of aerospace giant invests in PIRTEK Orlando

Webtec Technician’s Guide Available on Kindle

Emerson to showcase Floor to Cloud™ packaging solutions at PACK EXPO 2023 (Booth SL-6107)
ARGO-HYTOS Celebrates Grand Opening in China

Trelleborg Hires Hendrix as Industrial Sales Engineer for Southern USA

Ground Control: Electrohydraulic Precision in Mobile Machines
Sponsor

Sponsors