Positive Drug Tests Highest in 16 Years
Dramatic increases in Midwest
From PRNewswire
The rate of positive drug tests among U.S. workers hit a sixteen-year high in 2019, according to a new analysis released Aug. 25 by Quest Diagnostics.
In addition to overall increases in workforce drug positives, specific regions of the U.S., particularly the Midwest, experienced dramatic increases in positivity for cocaine, methamphetamine, and marijuana.
The Quest Diagnostics findings generally align with other research. Drug deaths in the U.S. rose 5% in 2019, driven largely by methamphetamine, cocaine, and fentanyl, following a decline in 2018. During the first few months of 2020, drug deaths increased about 13% compared with last year, attributable partly to social isolation and other disruptions caused by COVID-19.
“There is no question that before COVID-19, rates of workplace drug positivity were trending in the wrong direction, based on our Quest Diagnostics data,” said Barry Sample, senior director of science and technology at Quest Diagnostics.
“The enormous strain caused by COVID-19 may prove to be an accelerant on this disturbing trend. Organizations will need to consider the impact of COVID-19 not only on workplace safety but also as a health concern for their employees for some time to come.”
Methamphetamine use surged in Midwest
Over the last five years, methamphetamine positivity in the general U.S. workforce testing increased nearly 12% since 2015. The Midwest region experienced year-over-year increases, driven primarily by double-digit increases in the central northeast region during this period.
Over the past five years, methamphetamine positivity in the Midwest increased nearly 78% since 2015. Illinois, Indiana, Michigan, and Ohio increased at least two-fold. Wisconsin nearly doubled.
“While the national debate on drug misuse in the workforce has focused primarily on marijuana, increasing positivity rates for cocaine and methamphetamine are also cause for concern,” Sample said. “Positivity by drug and region can be random and unpredictable. Our data is a reminder that it is important to remain vigilant about all drug misuse in the workforce.”
Between 2018 and 2019, methamphetamine positivity inched up nearly 6% in general U.S. workforce tests and fell 6.3% in federally mandated safety-sensitive testing. Methamphetamine positivity changed little in the general U.S. workforce, up 12%, and was flat in federally mandated safety sensitive testing over five years.
The increased positivity rates for methamphetamine in urine test results were bolstered by similar patterns in other specimen types. Oral fluid methamphetamine positivity, which also assesses recent use, was up 4.3% since 2018 and up 69% since 2015; while methamphetamine positivity from hair tests, which gauges a pattern of drug use over time, was up 20% since 2018 and 60% since 2015.
“Testing with multiple specimen types can reveal a fuller understanding of patterns of misuse than one alone,” Sample said. “Our data suggests that testing for methamphetamine with hair and oral fluid may be appropriate for employers with concerns about misuse of this particular drug to complement the standard urine drug screen.”
Cocaine up in the Midwest and West
Cocaine positivity in general U.S. workforce testing increased in the Midwest and West regions over the past five years. Cocaine positivity in the Midwest increased by 40% and in the West by 53%. The Midwest was 20% less than the national rate in 2015 but 3.7% above the national rate in 2019, suggesting a surge in positivity in the region last year.
In the West, where cocaine positivity has been historically far lower, the cocaine positivity rate rose from 40% below the national rate in 2015 to 14.8% below in 2019. These increases in the West were primarily driven by increasing positivity since 2015 in Colorado, Nevada, and Oregon.
Opiate positivity declines
In the general U.S. workforce, positivity for opiates in urine drug testing continues to decline across all opiate categories. Urine drug test positivity for opiates, primarily codeine and morphine, in the general U.S. workforce declined more than 19% since 2018 and 49% over five years.
Among the more specific tests for other prescription opiates, the positivity for the semisynthetic opiates hydrocodone and hydromorphone dropped 26% over the past year and more than 45% over five years. Similarly, positivity for oxycodone and oxymorphone declined 21% over the past year and nearly 55% over five years.
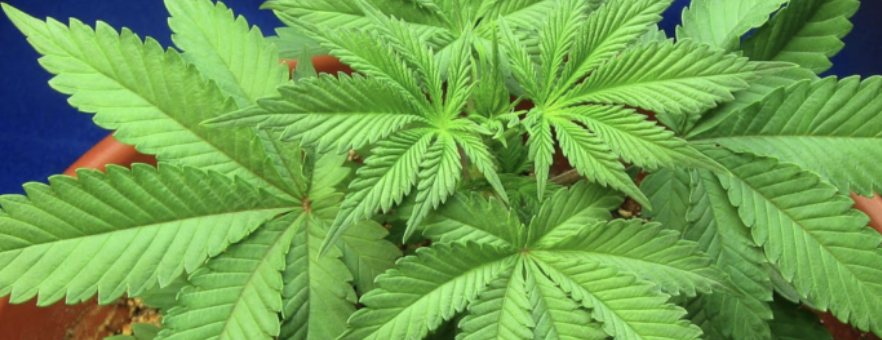
Marijuana most commonly detected drug
Marijuana continues to top the list of the most commonly detected illicit substances across all workforce categories and specimen types of urine, oral fluid, and hair.
In the general U.S. workforce, marijuana positivity increased nearly 11% in urine testing since 2018 and 29% since 2015. In the Midwest, marijuana positivity outpaced national increases in positivity in 2018 and 2019, increasing nearly 14%.
The West region also outpaced national positivity and saw double digit increases, as compared to the previous year, in 2017 through 2019. Marijuana positivity increased in the West by 24% since 2018 and 78% since 2015.
“Marijuana continues to be an enduring presence in the U.S. workforce. Changing attitudes toward its use could pose heightened risks, especially in safety-sensitive positions and those states exploring legalization,” Sample said.
Heroin rates decrease
Positivity rates for heroin continue to decline in general. Urine drug test results for the general U.S. workforce for heroin use declined 33% since 2018 and 50% since its peak in 2015 and 2016.
Positivity in the federally mandated safety-sensitive workforce category declined 15% between 2018 and 2019, with a decrease of more than 45% since 2015.
Significant increases in multiple industries
The Quest Diagnostics Drug Testing Index Industry Insights of general U.S. workforce positivity rates, based on more than 18 million urine drug test results between 2015 and 2019, shows year-over-year increases in overall workplace drug positivity in 15 of the 17 sectors reported.
The retail trade industry had the highest overall positivity rate across all five years of the analysis, reaching 5.5% last year. The accommodations and food service category had the highest workforce positivity for marijuana, at 4.8%, a relative increase of 65% over five years.
For an interactive map with positivity rates and trend lines by three-digit U.S. zip codes, visit DTIDrugMap.com.
Share this information.
Related Posts


Sponsor
Sponsors