Rise in February ’22 Hydraulic Shipments
The latest data published by the National Fluid Power Association shows continued growth in the 12 month moving average of pneumatic, hydraulic, and total fluid power shipments. The year-to-date change for total fluid power shipments in February 2022 is 18.8%. Raw index data show that pneumatic shipments stayed relatively the same when compared to last month, while mobile hydraulic and industrial hydraulic shipments are up. The following charts are drawn from NFPA’s Confidential Shipment Statistics (CSS) program.
Hydraulic and Pneumatic Shipments
Raw Index Data, Index: 2018=100
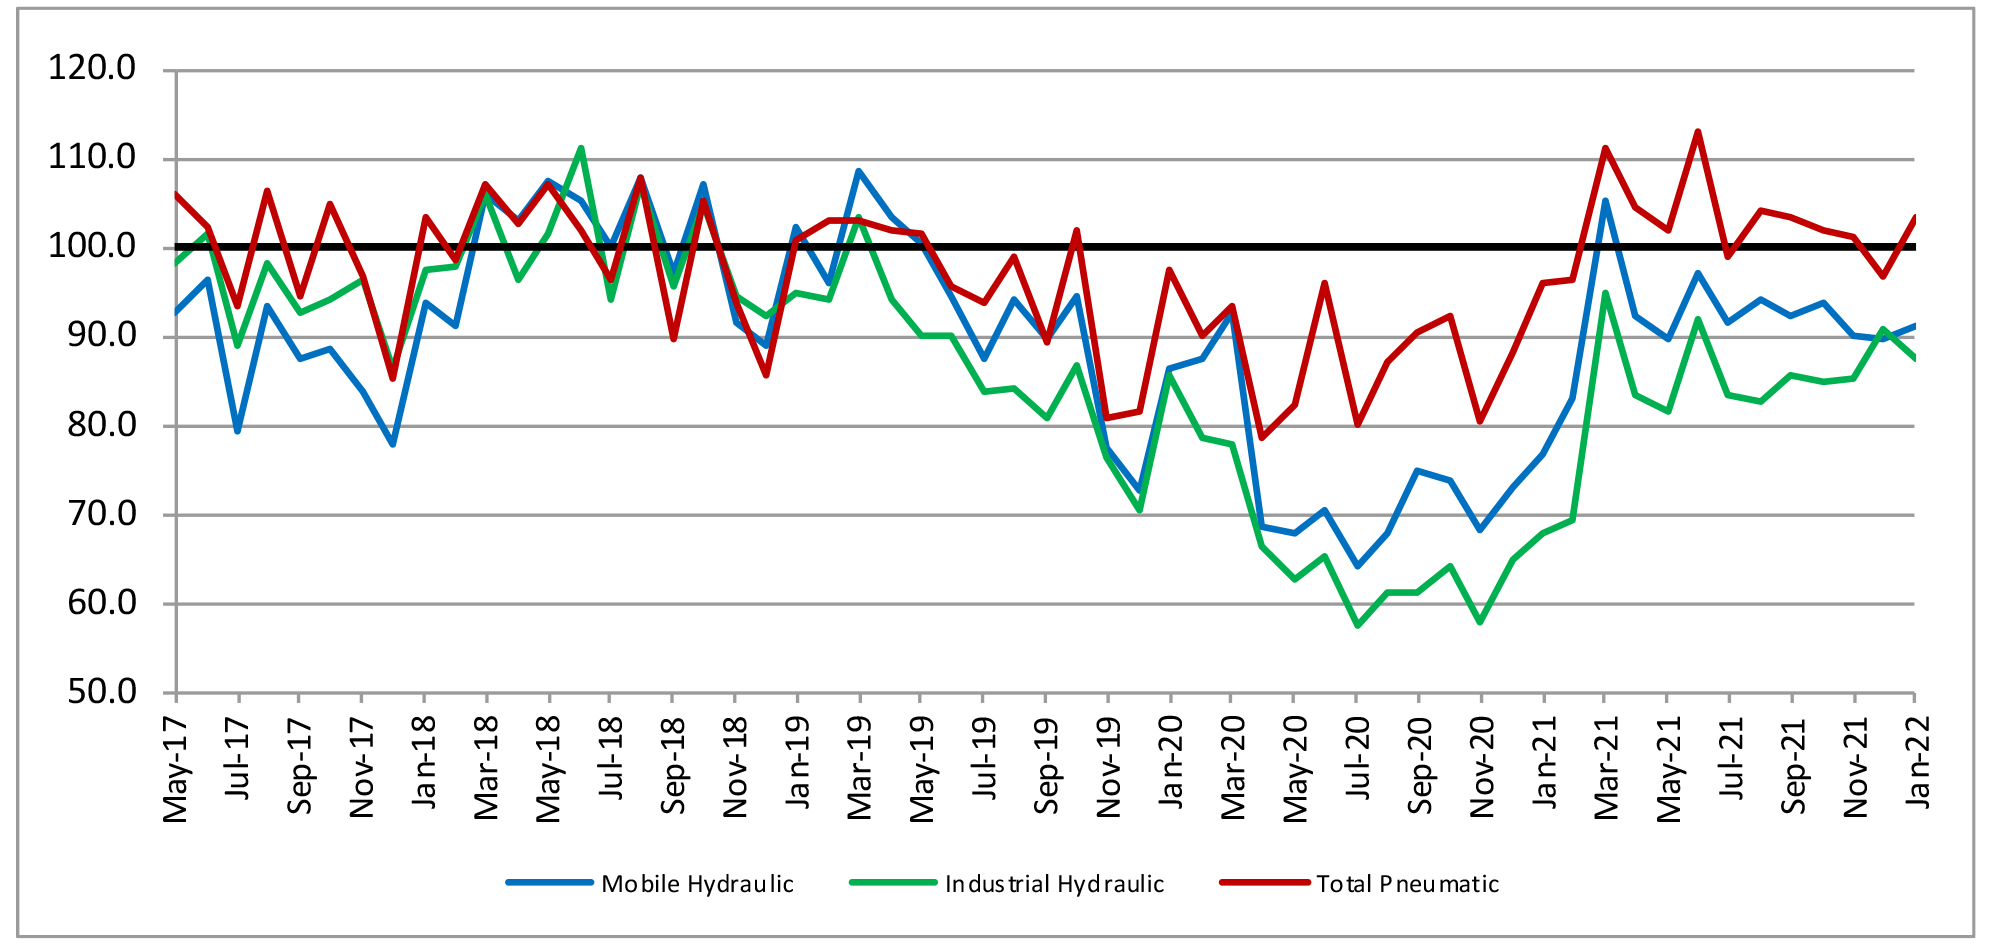
This graph of raw index data is generated by the total dollar volume reported to NFPA by CSS participants and compared to the average monthly dollar volume in 2018. For example, the February 2022 total dollar volume for pneumatic shipments is 103.5% of the average monthly dollar volume in 2018. (Base Year 2018 = 100)
Pneumatic, Mobile and Industrial Hydraulic Orders 12/12 Ratio
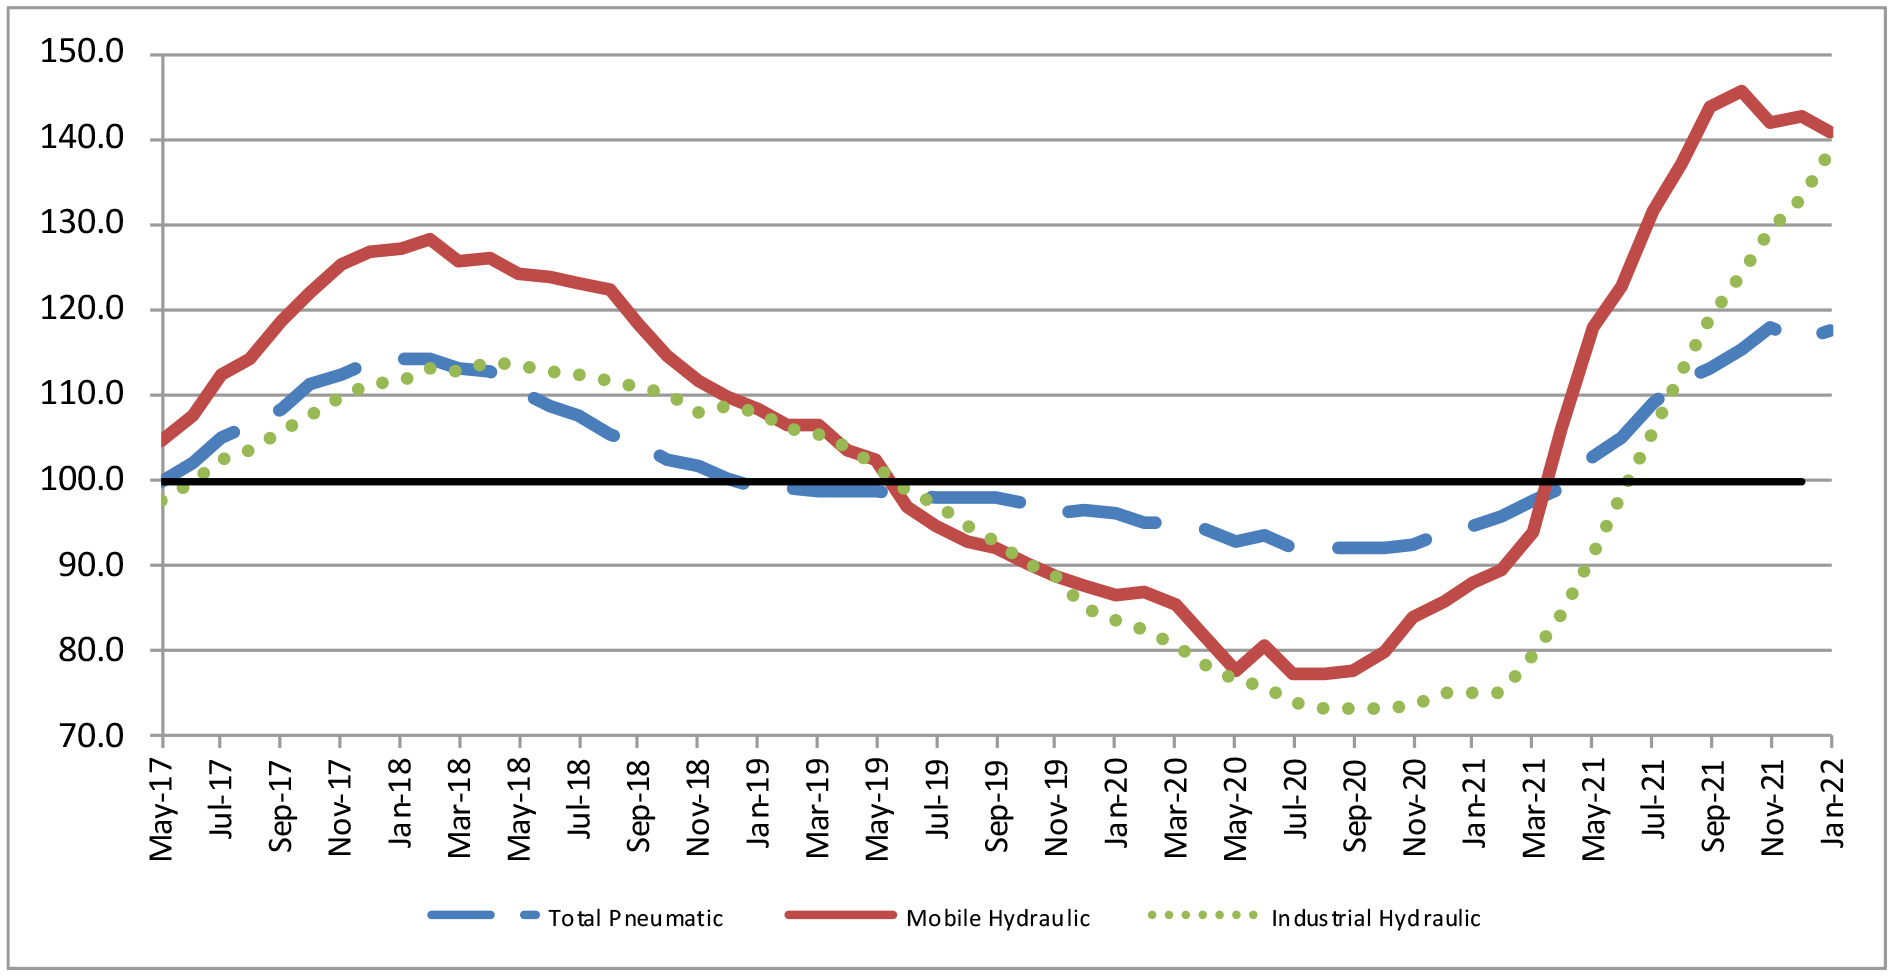
Each point on this graph represents the most recent 12 months of orders compared to the previous 12 months of orders. Each point can be read as a percentage. For example, 143.7 (the February 2022 level of the industrial hydraulic series) indicates that industrial hydraulic orders received from March 2021 to February 2022 were 143.7% of the orders received from March 2020 to February 2021. (Base Year
2018 = 100)
Total ‐ Hydraulic and Pneumatic Shipments 12 Month Moving Average
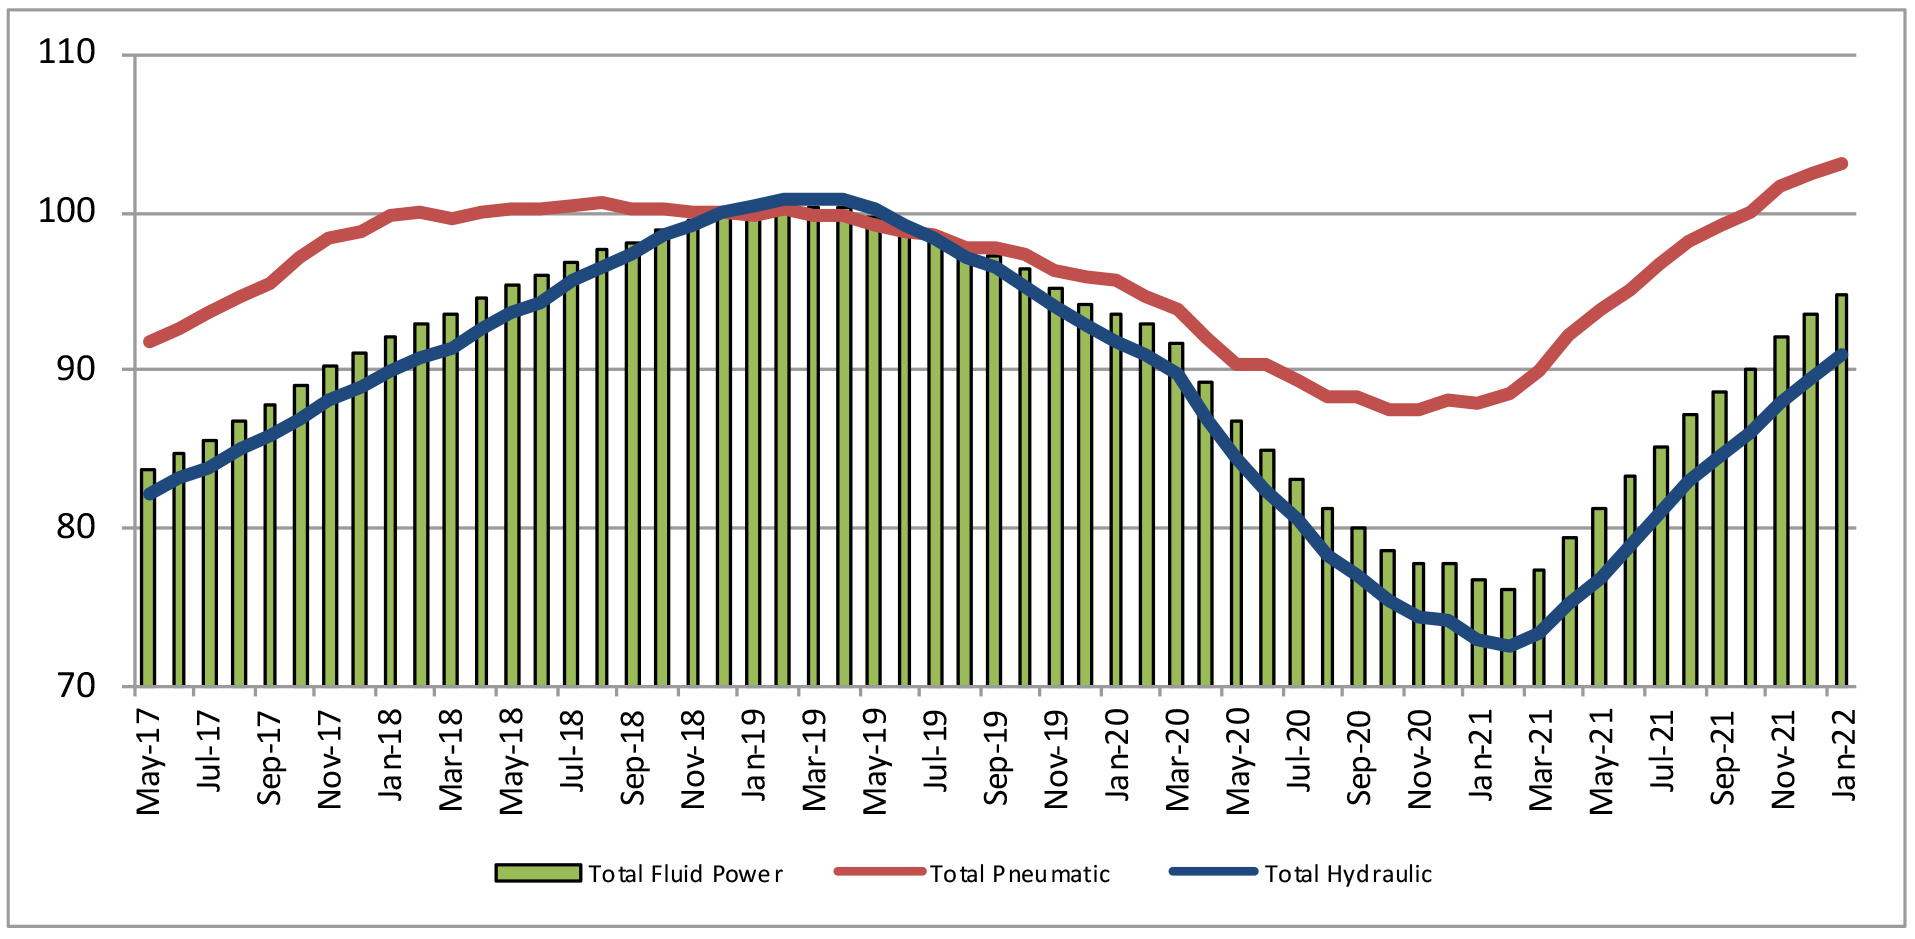
This graph of 12-month moving averages shows that in February 2022, the moving average for shipments increased across the board. (Base Year 2018 = 100)
Shipments – Cumulative year‐to‐date % change (2021 vs. 2020)
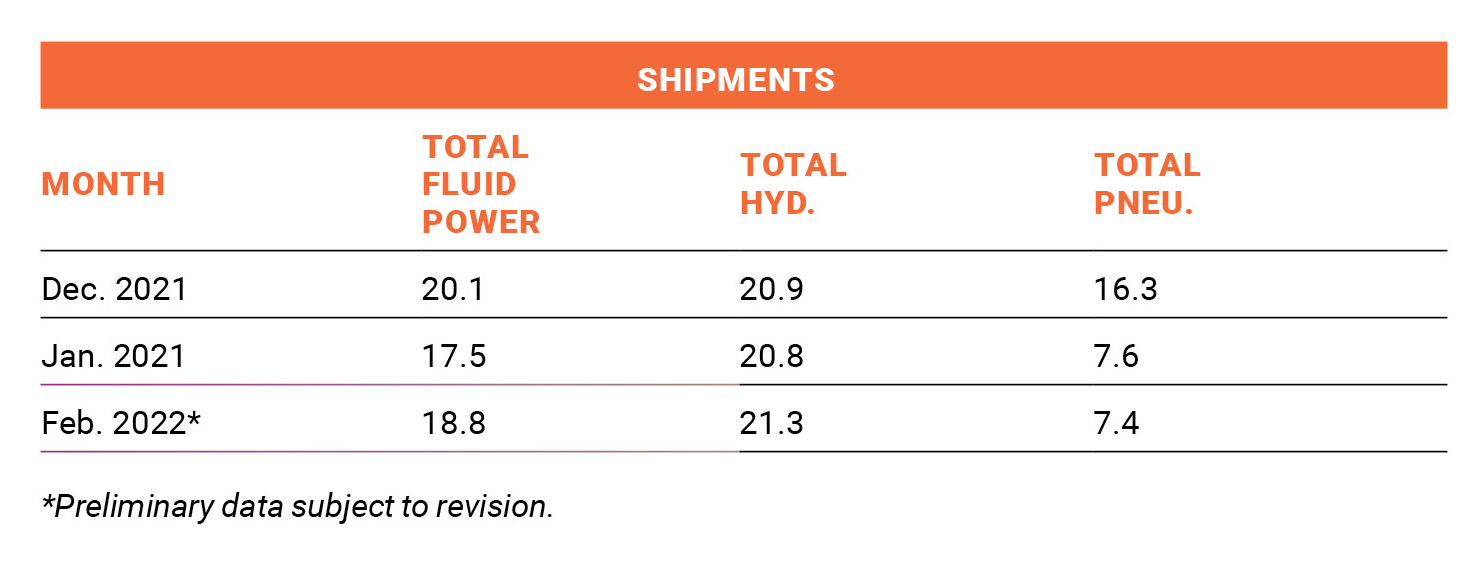 The table above is expressed in terms of cumulative percent changes. These changes refer to the percent difference between the relevant cumulative total for 2022 and the total for the same months in 2021. For example, February 2022 pneumatic shipments figure of 7.4 means that for the calendar year through February 2022, pneumatic shipments increased 7.4% compared to the same time-period in 2021.
Share this information.
Related Posts

Future of Fluid Power Session Confirmed for IFPE Conference

Winter is Over! Register Today for Foundation Invitational Golf Tourney

Fluid Power Research Aligned With NFPA Technology Roadmap
Students Learn About Fluid Power Through NFPA-Funded Projects
The NFPA Student Career Connections Program – An Easy Way to Connect with Students

Price Engineering Reaches Action Challenge Milestone in Conjunction with FAMTEN Community Debut
Sponsor
Sponsors