NFPA News
Fluid Power Industry Growth Trend
The latest data published by the National Fluid Power Association shows January 2025 total fluid power shipments decreased 8.7% from the previous month and were -14.5% below January 2024’s index. 3/12 and 12/12 rates of change for total fluid power, hydraulic, and pneumatic shipments are negative and trending downward. The data and charts above are from NFPA’s Confidential Shipment Statistics (CSS) program where over 70 manufacturers of fluid power products report their monthly orders and shipments. More market information is available to NFPA members, allowing them to better understand trends and anticipate change in fluid power and the many customer markets it serves. Contact NFPA at 414-778-3344 for more info.
Total Fluid Power Shipments
Index Data: 3 Month Moving Average & 12 Month Moving Average
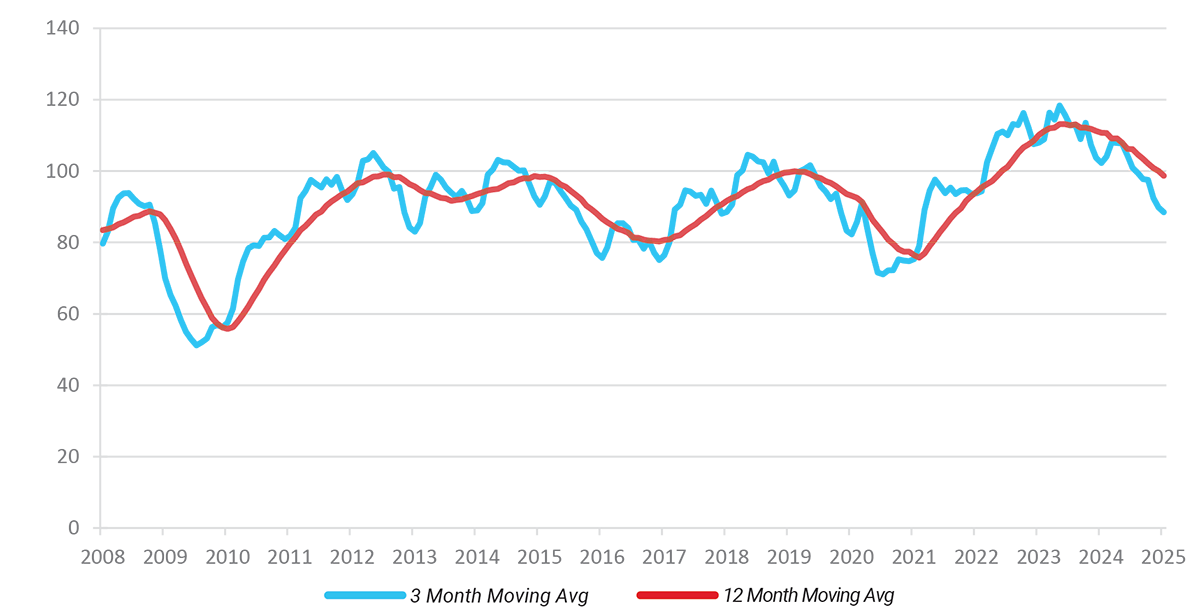
This graph of index data is generated by the total dollar volume reported to NFPA by CSS participants. This graph uses moving averages to smooth out the data and clearly identify trends. (Base Year 2024 = 100).
Shipments: Pneumatic, Mobile Hydraulic, and Industrial Hydraulic
Index Data: 12/12 Rate of Change
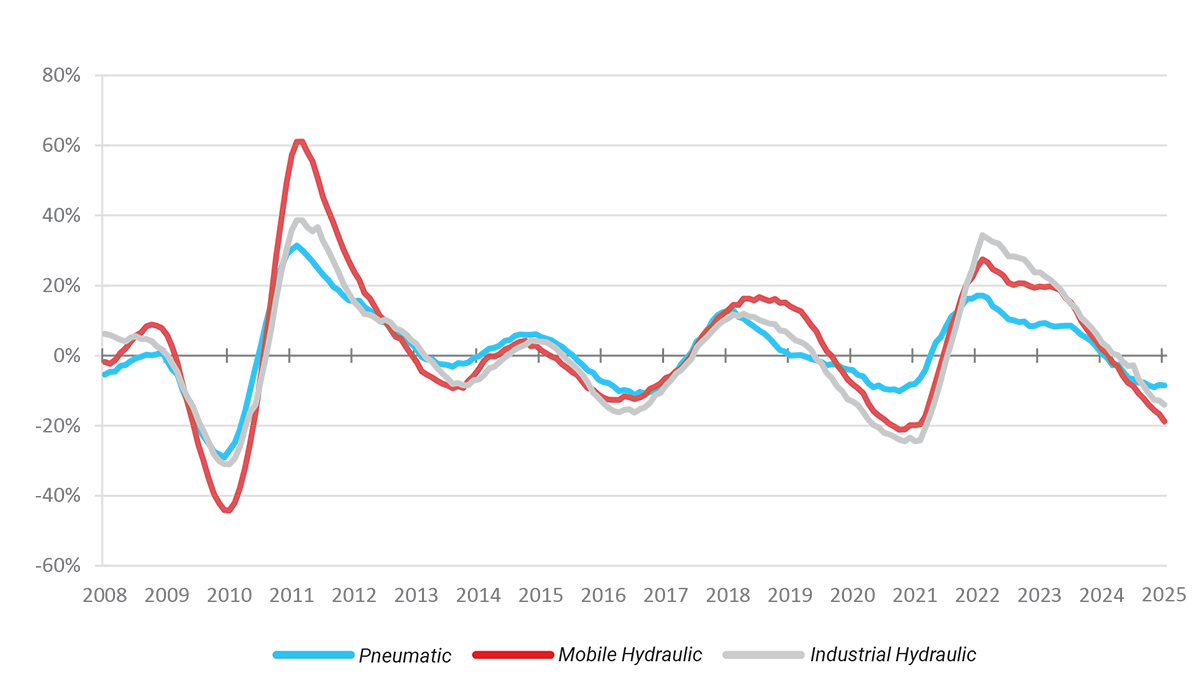
Each point on this graph represents the most recent 12 months of shipments compared to the previous 12 months of shipments. For example, 7.3% (the August 2023 level of the pneumatic series) indicates that the value of pneumatic shipments from September 2022 to August 2023 were 7.3% higher than the value of pneumatic shipments from September 2021 to August 2022.
Orders: Pneumatic, Mobile Hydraulic, and Industrial Hydraulic
Index Data: 12/12 Rate of Change
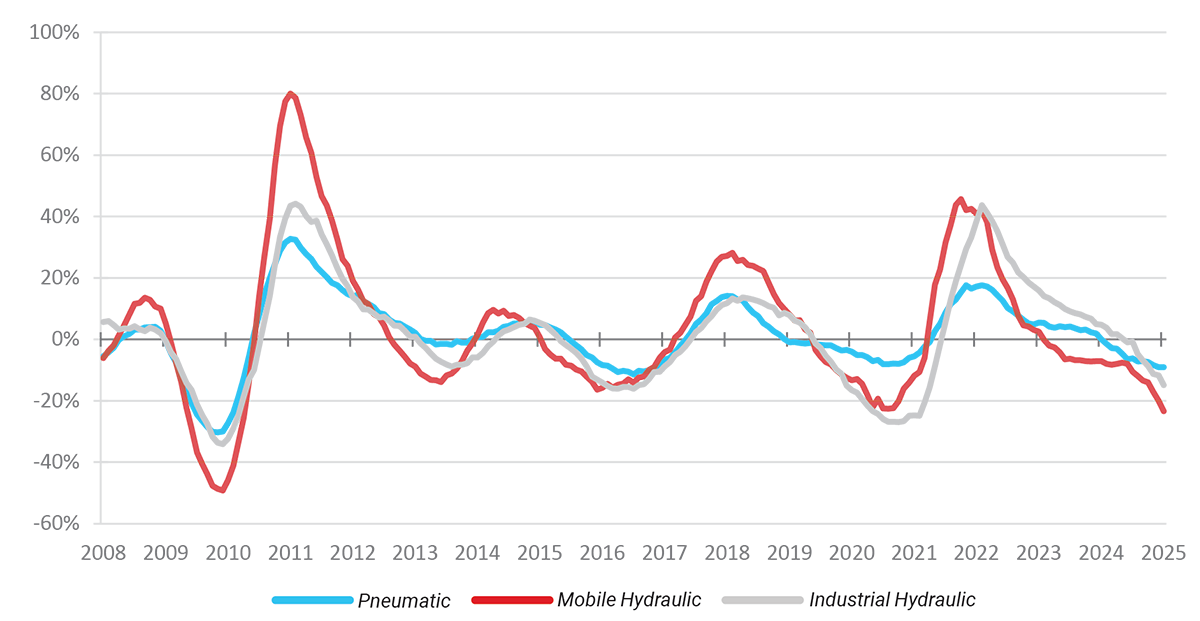
Each point on this graph represents the most recent 12 months of orders compared to the previous 12 months of orders. For example, 8.5% (the August 2023 level of the industrial hydraulic series) indicates that the value of industrial hydraulic orders received from September 2022 to August 2023 were 8.5% higher than the value of industrial hydraulic orders received from September 2021 to August 2022.
Total Shipments: January 2025*
M/M% |
Y/Y% |
3/12% |
12/12% |
|
| Shipments | Shipments | Shipments | Shipments | |
| Fluid Power | 8.7 | -14.5 | -13.5 | -10.9 |
| Pneumatic | 6.0 | -10.0 | -8.3 | -8.5 |
| Hydraulic | 9.4 | -23.4 | -22.7 | -16.9 |
The table above shows various rates of change for the month of September 2024. Interpretation for each rate of change calculation:
– M/M %: The percent change between the current month and the previous month.
– Y/Y %: The percent change between the current month and the same month one year ago.
– 3/12 %: The percent change between the three most recent months and those same three months one year ago.
– 12/12 %: The percent change between the twelve most recent months and those same twelve months one year ago.

Fluid Power Industry Growth Trend
The latest data published by the National Fluid Power Association shows January 2025 total fluid power shipments decreased 8.7% from the previous month and …

NFPA Fluid Power Challenge Launches new website
by Lynn Beyer, NFPA Director of Workforce Development Programs I was moderately upset when Instagram recently changed its format. This social media site has …
NFPA Continues to Strengthen the Fluid Power Industry
By Tricia Fulton, CFO, Sun Hydraulics Corp., 2016-17 NFPA Chairwoman of the Board In June of this year, the NFPA Board of Directors held its annual strategic …

Funding for Fluid Power Research Takes Another Step Forward
by Eric Lanke, NFPA CEO Not too long ago, I wrote about NFPA’s day on Capitol Hill—when several NFPA members and I met with 20 or so Congressional offices …
IFPE 2017 Exhibitors’ Education Meeting on August 23 in Chicago
Rick Guidish of Deltrol Fluid Products, representing the IFPE 2017 Management Committee, and Rich Goldsbury of Bobcat/Doosan, chair of the CONEXPO-CON/AGG …

Fluid Power Challenge Re-Cap: Alexandria Technical and Community College
Alexandria Technical and Community College (ATCC) hosted an NFPA Fluid Power Challenge event for the first time on its campus on February 24, 2016, where 68 …

NFPA Elects Tricia Fulton to be Chairwoman of the Board of Directors
The NFPA officially has elected Tricia Fulton, the CFO at Sun Hydraulics, to be the Chairwoman of the Board of Directors for the 2016-17 fiscal year. Fulton is …

NFPA’s Day on Capitol Hill
by Eric Lanke, NFPA CEO Thanks to all the NFPA members who joined me February 9-10 for our first “day” on Capitol Hill. Representatives of Caterpillar, …

NFPA’s Role in Fluid Power Standardization Advocacy
by Eric Lanke, NFPA CEO Standards development is a key activity that contributes to the fulfillment of NFPA’s mission to strengthen the fluid power industry. …

NFPA Members Start School Year Strong with Fluid Power Challenge Events
NFPA Fluid Power Challenge veterans started the school year out with a bang! The Challenge is a competition where middle school students solve an engineering …

NFPA Releases Annual Report on U.S. Fluid Power Industry
Presentation Available for Member Use In an attempt to raise the profile of the fluid power industry in the general public and public policy arena, NFPA has …
Energy Efficient Fluid Power Conference Will Return at IFPE 2017
by Eric Lanke, NFPA CEO The Energy Efficient Hydraulics and Pneumatics Conference (EEHPC) is an event co-sponsored by NFPA, the FPDA Motion & Control …
NFPA Annual Conference Speakers Prepare You for What’s Next
The NFPA 2016 Annual Conference slate of speakers is complete and impressive. This stellar line-up will not only provide attendees with insights into what may …
Exhibiting Space Filling Fast!
Hosted by NFPA within the Motion, Drive & Automation North America (MDA NA) and Industrial Automation North America (IANA) shows, the IFPE Fluid Power Zone …

Spring Regional Meeting Dates Announced
Register Today! NFPA will be on the road again this spring hosting regional meetings in both the Detroit and Minneapolis areas. As always, NFPA Regional …

ISO Technical Committee Works to Advance Energy Efficiency
The International Standards Organization (ISO) technical committee for fluid power (TC 131), along with 19 of its subcommittees and working groups, converged …

Call for Presenters: Share Your Expertise at Motion, Drive & Automation North America at IMTS
Help increase energy efficiency and productivity! NFPA is looking for industry experts to discuss best practices in fluid power at the Integrated Industries …

NFPA’s New Market Information Website Launched
The new market information website now serves as the main point of entry for all NFPA data and reports on the latest industry trends, size, and forecasts for …

Fluid Power Industry Reviews, Selects Research Projects for CCEFP
One of the most common questions I get about the Center for Compact and Efficient Fluid Power (CCEFP) is how they pick which research projects to fund. It’s …
NFPA Board Continues Focus on Growing the Fluid Power Workforce
by Eric Lanke, NFPA CEO As our Chairman Jeff Stuart expressed earlier this year, NFPA and its Board of Directors are increasing its focus on a set of clear, …
Sponsor
Sponsors