Why Machinery Builders Need Component Reliability Data
As the title suggests, fluid power components are supposed to have some sort of measurable reliability. And that data is available – yes? Well, not right now. But, read on – there is progress!
Reliability is something that statisticians like to banter about—using Weibull graphs to impress others. The Europeans have taken a liking to that, especially those who are involved in machinery safety. Given the fact that accidents happen, why not look at statistics to see if it could be used for improving safety? Well, a Machinery Directive was implemented in the European Union that requires machinery builders to make a risk assessment, which is a statistical calculation based on the likelihood of an accident and its degree of severity. In their wisdom, the lawmakers who passed the directive did not specify how such a risk assessment should be made, but rather left that detail to the technical experts. So the statisticians marched in.
The electronic industry was well advanced in assessing risk and had data on a lot of their components. They knew, for example, how long a resistor would probably last before it failed and used statistics to calculate the length of time before it had to be replaced on a machine. As the analysis expanded to mechanical equipment, like fluid power products, use of reliability data was simply swept into the process. But it was soon realized that the fluid power industry did not have such data; most of us had not even heard of reliability. So the technical experts did what everyone else does when faced with a lack of information—provide a default value and let machinery builders use better data if it becomes available.
But there was one exception—hydraulics. In Germany, BIA – Report 2004/6 documented a field study of several hundred valves in a few installations where failures were recorded over more than a three-year period. A statistical method was applied to calculate the mean-time-to-dangerous failure. The results were rationalized to be 150 years, and that became the default value for hydraulics. Doesn’t 150 years sound impressive? But wait…that data was not as extensive a collection as the electronic industry had collected over the years. Default values for electrical components, divided into many types, are in thousands of years! The 150 years for hydraulics is paltry by comparison.
What, you say? Thousands of years—are you serious? Yes, those are the values found in the tables of ISO 13849-1 (the source is a Siemens 1999 Report SN 29500). But take that in context. That is not the actual time that any one component will last. It is the mean-time-to-dangerous failure for 63.2% of the entire population of a component. Which is still a lot of time, but then electrical components (like transistors, resistors, etc.) do have rather high reliability. Also, these high mean-time-to-failure values are just used in further statistical calculations. When a series of components are connected together, the combined reliability of a circuit is much lower than the thousands of years for a single component. In addition, there is a mission time—usually where 10% of the population fails. That is the time for component replacement, whether or not it has failed.
Pneumatics did not fare as well because there was not any field study. So a default value of 20-million cycles was listed for a B10 life. This is the Weibull statistic again, where 10% of a population is likely to fail. And it is based on cycles instead of time. The logic here was that pneumatic valves (in particular) operate in cycles, and the time function is dependent on the application—how many cycles in a year to calculate the mean-time-to-dangerous-failure. (The data available for hydraulic valves was not in cycles, so it used the time function directly.)
So is the default value for fluid power products OK? Not according to some outspoken members among the German machinery builders. Replacing pneumatic valves on machines, based on the newly calculated mission times, is too short. The same valves on machines made in the past did not have to be replaced under the old rules and lasted longer.
Well, the pneumatic reliability working group in ISO TC 131 had actually developed a set of four ISO standards for estimating the reliability of pneumatic products. This is the ISO 19973 series published in 2007 that covers valves, cylinders, and regulators.The standards describe procedures for laboratory testing of the components and include criteria for threshold values where calculations for the statistics are made, like B10 and mean-time-to-failure life.
Component manufacturers can use these procedures to obtain the data needed by the machinery builders, and it could be better than the default values.
Why should U.S. component manufacturers be interested in providing such data for compliance with an EU machinery directive? The answer is that the fluid power industry is global, and machinery builders in the EU buy components globally. Furthermore, machinery builders in the U.S. must comply with the EU directive if they export their machinery into the EU. And they also buy components globally. So it is in the interest of U.S. fluid power manufacturers to obtain reliability data on their components.
There are contrarians who will say that laboratory testing is not representative of actual field conditions—and they are right. Reliability data from field use is the best, but often the operating conditions are not documented or well controlled, nor are the times to failure (and the modes of failure) well recorded. The accuracy of the data is often suspect.
Laboratory testing is better controlled and has ISO standards to specify the test methods, at least for pneumatics (the ISO 19973 series, Parts 1 to 4). One ISO standard does exist for hydraulic components (ISO 19972) but does not include details for test methods. There are, however, NFPA standards for laboratory testing hydraulic components (NFPA T2.12.11-2-2007). A standard for properly collecting field test data for either hydraulic or pneumatic components is NFPA T2.12.11-1R1-2009.
Before going further, an explanation is necessary for a term used above: dangerous failure. This sounds ominous, and is intended to be so. The experts who wrote ISO 13849 (which is used to estimate the risk in safety-control circuits) recognized that not all failures result in accidents. A leaking valve will continue to operate, and it may cause the machine to be slow. Loss of production is not a dangerous failure. Loss of a safety function because a sticking valve did not shift on time is dangerous. So the mean-time-to-dangerous failure was adopted as a clarification to the statistical “mean time to failure.”
Now what does a machinery builder do with the reliability data? Let’s take an example from the German BGIA Report 2/2008e that describes a pneumatic circuit (Fig. 1).
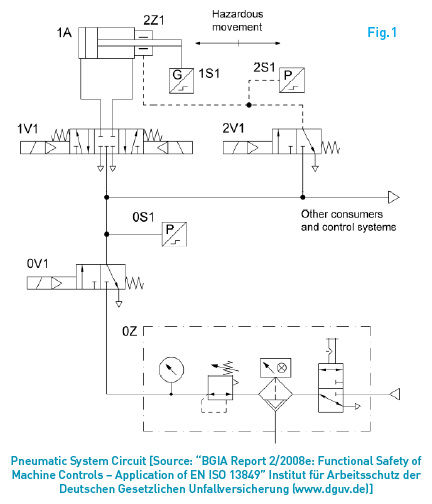
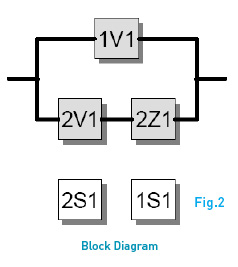
In this example, cylinder motion is controlled by a 5-port, 3-position valve, 1V1. At the end of each stroke, valve 2V1 is de-energized to engage the rod brake 2Z1 and hold the rod in a fixed position. These three components are operated every cycle. Displacement sensor 1S1 monitors the time/distance condition of the cylinder motion, and sensor 2S1 monitors pressure in the rod brake circuit. Valve 0V1 is a system shut-off valve, and sensor 0S1 senses system pressure. An FRL set OZ conditions the air supply to the circuit.
If a person puts their hand into the machine while the cylinder is moving, some device will sense that—like a light curtain. That triggers a series of signals to valve 1V1 to shift into the center position, blocking the supply and exhaust lines. In addition, valve 2V1 shifts to engage the rod brake and stop the rod motion. Of course, we all recognize that the pneumatic cylinder will not immediately stop when the 3-position valve shifts because of the compressibility of air. That is why the rod brake is added as a secondary safety device to stop the motion more quickly. It also serves as a backup if the 3-position valve fails.
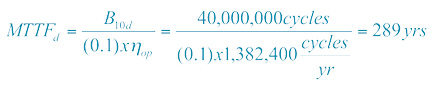
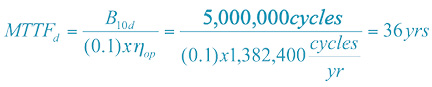
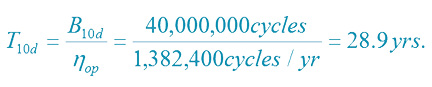
Now, the probability of failure of the system is calculated from reliability data of the components. Suppose that the valve manufacturer gave the machine builder a B10d value of 40-million cycles for each valve—a figure better than the default value. Suppose also that the rod brake manufacturer provided a B10d value of only 5-million cycles – less than the default value. These figures are now used to calculate the mean-time-to-dangerous failure using the equations from ISO 13849-1. But first, a conversion is necessary from cycles to time in years. The machine being built is designed to operate one cycle every 10 seconds, 16 hours a day, and 240 days a year. That means the operating time is
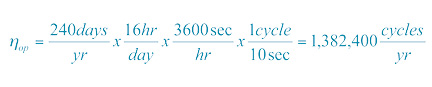
The mean-time-to-dangerous failure for the valve is
Similarly, for the rod brake:
The block diagram of Fig. 2 shows that this is a 2-channel safety circuit, and a mean time for each channel must be calculated. The upper channel has only one component, so

The second channel has two components in series and is calculated as follows:
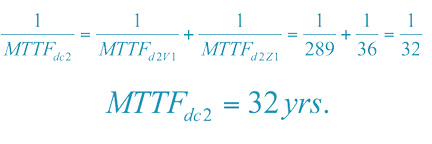
The “symmetrized” mean-time-to-dangerous failure for the entire circuit combines the two channels in another calculation. But a rule in ISO 13849-1 states that the mean-time-to-dangerous failure for a channel is limited to 100 years. So the 289-year figure for channel 1 is capped at 100 years in the symmetrized calculation:
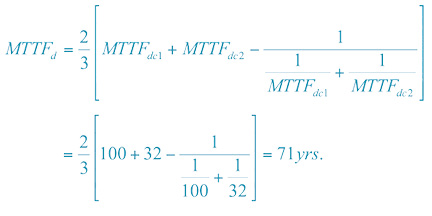
This figure is high. It qualifies the circuit for a performance level of “d” and a category 3. (Other considerations of diagnostic coverage and common cause failure must be also determined for this qualification, but are not included in this example.)
Now, keep in mind the point made earlier that the mean-time-to-failure is a statistical figure, which estimates that 63.2% of the circuits in all of the machines produced will likely fail by 71 years. Since that percentage is too high for safety, a mission time is calculated—the amount of time when only 10% of the systems would have failed. The mission time for the valves is calculated as follows:
And the mission time for the rod brake is
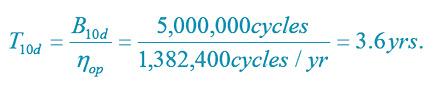
So the valves have to be replaced after 28 years, and the rod brake has to be replaced after three years, even if they have not failed. That’s good for the valves, at least in this hypothetical example.
 All of these calculations by the machine builder are dependent on reliability values provided by the component suppliers. It was pointed out earlier that the ISO 19973 series of standards provides a means for pneumatic-component manufacturers to test products in their laboratories and obtain reliability values—typically B10 values. However, when these standards were published, the difference between dangerous failures and all failures was not included in the standards. In order to help machine builders with this issue, the ISO 13849-1 standard provides a default method to obtain B10d values from B10 values. The default is simply B10d = 2 times B10.
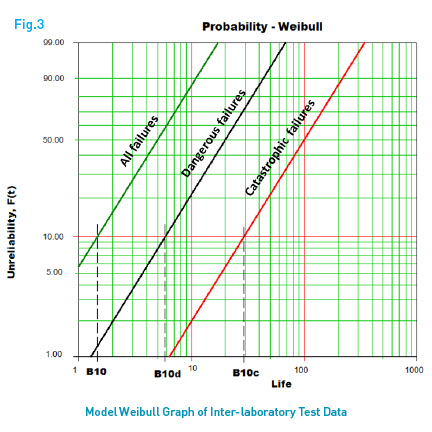
The ISO pneumatic working group has taken up this issue by proposing a revision to define dangerous failures and determine, directly, the B10d value. A protocol has been written to try this in several laboratories before adoption into the ISO standard. An international Inter-laboratory Test Program was started in 2012 with 11 laboratories in seven countries testing their pneumatic valves with this protocol. But the effort is more than just evaluating the default factor of “2” or obtaining B10d values directly. The test is extended to measure catastrophic failures and plot Weibull curves for all three failure criteria: all failures (including leakage), dangerous failures (typically failure to shift), and catastrophic failures (complete cessation of function). The comparison of these failures is demonstrated in a model Weibull graph shown in Fig. 3.
Conclusion
We started this article with the question on why machinery builders need reliability data from fluid power component manufacturers. If fluid power components are to continue being used in safety circuits of machinery, it is to our advantage to have better data than the default values now listed in the ISO 13849-1 standard. Even though the Machinery Directive applies only to the member nations of the EU, all machinery imported by the EU from other nations in the world must comply with the Directive. Thus, it is to our advantage to have the data available for all machinery manufacturers.
This article is based on a presentation at the 2013 Fluid Power Systems Conference held in Rosemont, Ill., from November 19-21, 2013. Plan to attend the next Fluid Power Systems Conference in Spring 2015. Reinforce your industry expertise with a Pneumatic Mechanic, Technician, or Specialist certification. Apply online at www.ifps.org.
Share this information.
Related Posts


Sponsor
Sponsors