Don’t Ignore the Basics
Workers at a small fiberglass manufacturer implemented some good efficiency measures a few years ago, yet some basic elements of their system were ignored. As a result, their production tools were experiencing performance problems even though the new Variable Speed Drive (VSD) air compressor had its discharge pressure turned up as high as it could go. Using some simple pressure measurements, a compressed air auditor was able to identify that some undersized basic system components were the cause of the problem.
Poor Performance
Compressed air-powered hand tools are used in the plant to cut large fiberglass pieces out of the moulds, and to shape and finish them for final shipping to the parent company. The cutting tools did not perform very well when operators tried to make their cuts to release the pieces from the moulds. At first, when starting the operation, the performance was acceptable, but the tool would quickly slow and sometimes stall, well before the cut was complete. As a result, even though the tool was rated at 90 psi, the compressor discharge pressure had to be boosted to 140 psi to gain adequate production output. Even with this excessively high pressure, the tool performance was not up to standard levels. This excessive pressure increased the air compressor power consumption by about 18% and also caused an almost 30% increase in the compressed air flow consumed by all of the unregulated uses in the plant.
After receiving complaints from the customer, the supplier of the compressed air tools contacted a compressed air auditor, hoping a solution to the problem could be found. The auditor placed some data loggers on the system to determine a pressure profile between the compressor discharge and various key points on the system. Using this information, the auditor put together a system pressure profile (Fig. 1).
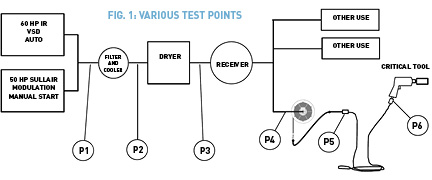
Production Equipment Pressure P1 to P3
Pressure points P1 to P3 were measured, and the pressure differential across the system filter, an external aftercooler, and an air dryer was found to be as high as 78 psi at full system flow. The compressor itself was maintaining very stable pressure, but due to a large restriction in the aftercooler (the unit had become plugged over time), adequate stable pressure could not reach the plant. The pressure differential across the filter and the dryer was less than 4 psi at full flow. The cooler had originally been installed to condition the very hot air produced by two reciprocating compressors. But these compressors had been replaced by a screw compressor that had an onboard cooler. Based on this information, the plugged cooler was removed with a significant improvement in the pressure. This allowed a 20-psi reduction in compressor discharge pressure, which was required because the new screw compressor could only operate at 125 psi. Surprisingly, it didn’t improve the tool performance problems.
Compressed Air Distribution P3 to P4
Special measurements were done to see if the pressure differential across the plant piping system was causing an issue. The plant had a large 4-inch ring main running along the outside walls of the plant, but the inner pipe network was a complex and sometimes confusing jumble of odd-sized pipes. Critical areas were identified and data loggers were placed to detect the pressure during the production cycle. At first glance, plant personnel felt sure it was the piping that was causing the poor tool performance. One contractor even quoted over $30,000 of piping improvements to upgrade undersized areas. Once the data loggers were full, they were downloaded, and it was determined that only 3 psi of piping differential was being experienced from test point P3 at the discharge of the air dryer to P4 at the beginning of the piping drop to the most critical end use, an air-operated cutter.
End Use P4 to P5
As it was not practical to place data loggers on the tool itself, some basic tests were done using a simple testing setup made of a T connection, two quick-connect couplings, and a gauge. The test setup was connected at points P4 to P6 to measure the pressure differential at each point after the quick-connect couplings while the tool was in operation. Each test required two measurements: one with the tool at rest and the other when the tool was in operation. The test with the tool at rest measured the system pressure. Comparing this pressure against the reading when the tool was in operation showed the approximate pressure differential from point P4.
The test of the cutter showed that with no air flowing, there was 118 psi at the test gauge. With the tool in operation, the pressure fell to 44 psi. Since the tool is rated for a pressure of 90 psi, full performance was not being achieved. An analysis of the path through which the air had to travel showed that for this tool, the excessive pressure loss of 74 psi was being caused by a hose reel, four undersized quick-connect couplers, and 60 feet of hose.
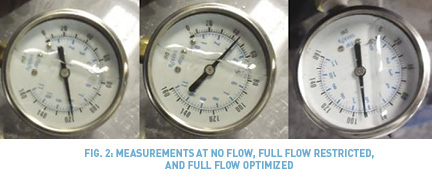
As an experiment, all the quick-connect couplers and the hose reel were removed, except for an upsized full-flow connector at the tool. A second test showed the operating pressure at the tool was now above 90 psi. At this pressure, the performance of the cutter was very noticeably improved—so much so, in fact, that production personnel refused to allow the experimental setup to be removed. It should be noted that with this improved situation, the pressure differential across the hose and fittings is still 26 psi when the tool is in operation, representing a loss of 22%. A target loss should be no more that 10% from the discharge of the compressor to the critical end use, including the air dryer and filter. This will require an increase in hose and connector size, and a reduction in the length of the hose by properly extending and locating the larger-sized distribution steel piping drop closer to the work location.
The operating cost and performance of this system, and the tools connected to it, can be greatly improved by paying attention to, and improving, some basic system components. Sometimes some simple measurements can detect major problems where they are least expected.
By Ron Marshall, Compressed Air Challenge. To learn more about analyzing your system pressure profile, consider taking part in Compressed Air Challenge’s next Fundamentals of Compressed Air Systems webinar starting on February 23, 2014. Visit www.compressedairchallenge.org.
Share this information.
Related Posts

Fluid Power Industry Creates ISO Standards that Impact Our World

Sustainable Considerations for Fluid Power & Off-Highway OEMs
Ceramic Air Valves Reduce Maintenance Cost

Improving Cybersecurity in Manufacturing: What to do (and why it matters)
6 Surprising Capabilities of Modern Hydraulics
Electrohydraulics: On the Road to Zero
Sponsor

Sponsors