Fluid Power Shipments Grew in March
The latest data published by the National Fluid Power Association shows that shipments of pneumatic, mobile hydraulic, and industrial hydraulic products grew in March compared to February in the raw index data. The year-to-date change for total fluid power shipments in March 2022 was 14.9%, down from February. The 12-month moving average of all shipments has been growing at a steady rate since February 2021. The charts below are drawn from NFPA’s Confidential Shipment Statistics (CSS) program.
Hydraulic and Pneumatic Shipments
Raw Index Data, Index: 2018=100
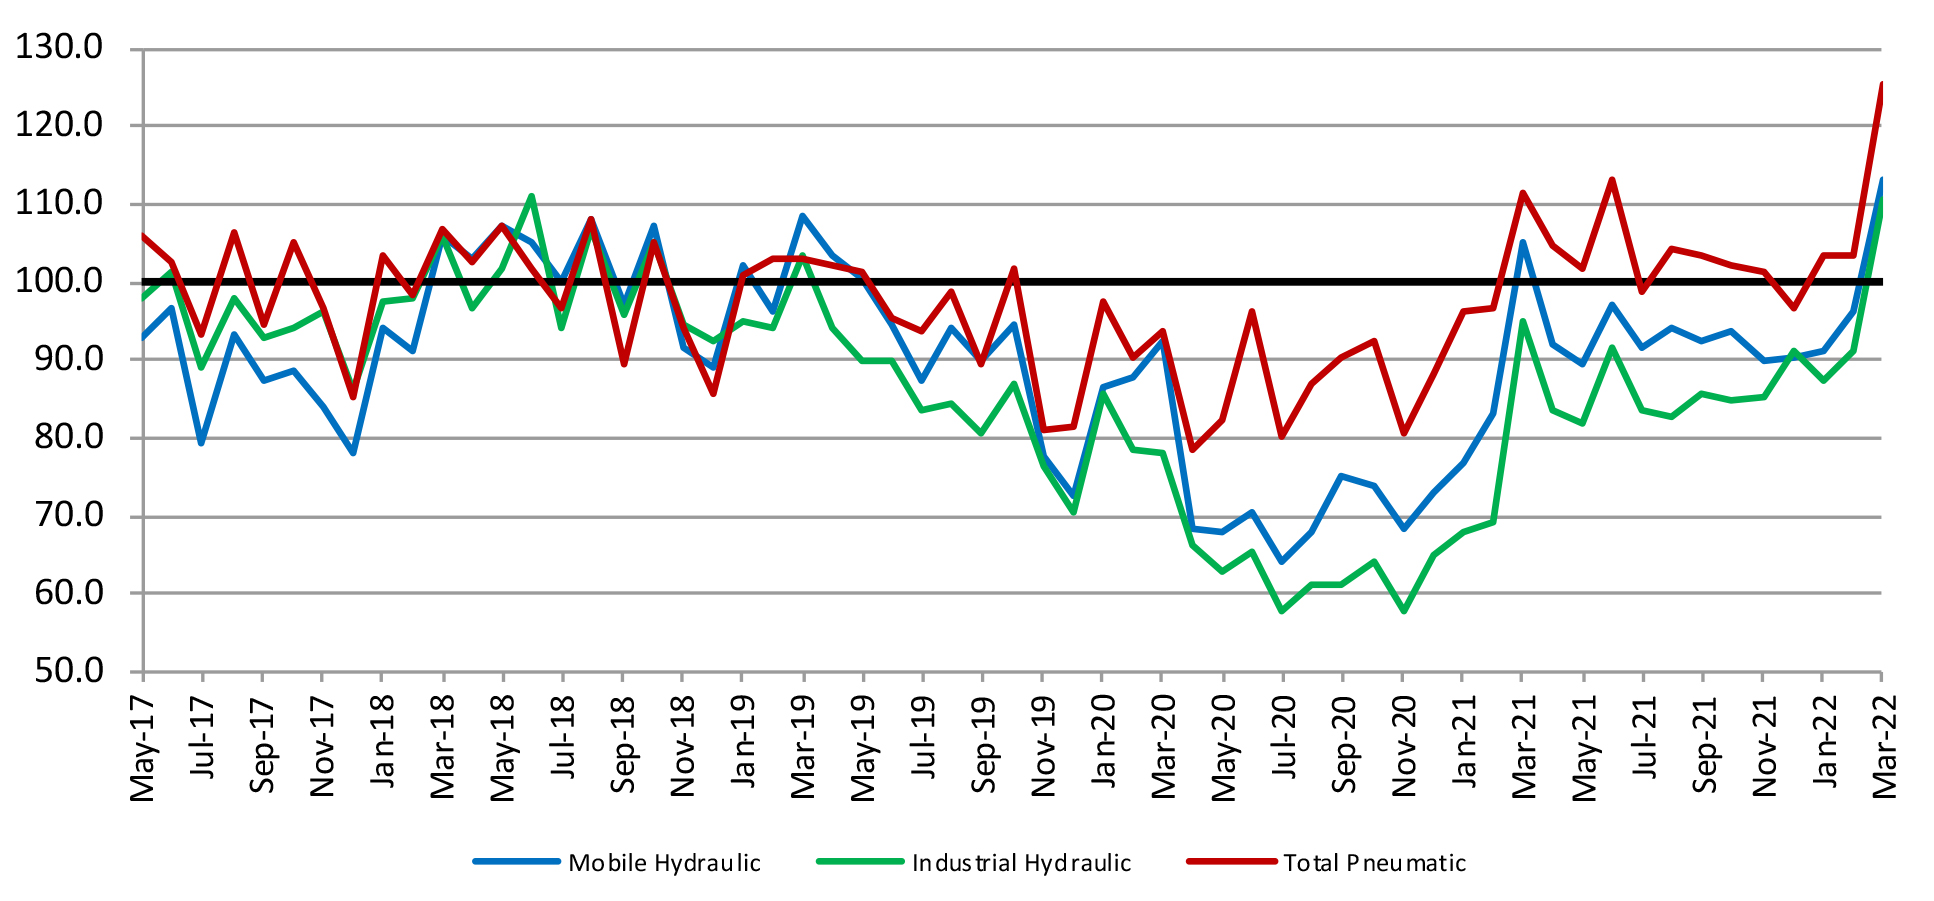
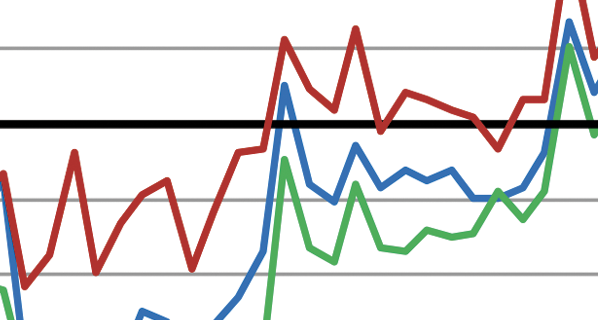
This graph of raw index data is generated by the total dollar volume reported to NFPA by CSS participants and compared to the average monthly dollar volume in 2018. For example, the March 2022 total dollar volume for pneumatic shipments is 125.3% of the average monthly dollar volume in 2018. (Base Year 2018 = 100)
Pneumatic, Mobile and Industrial Hydraulic Orders 12/12 Ratio
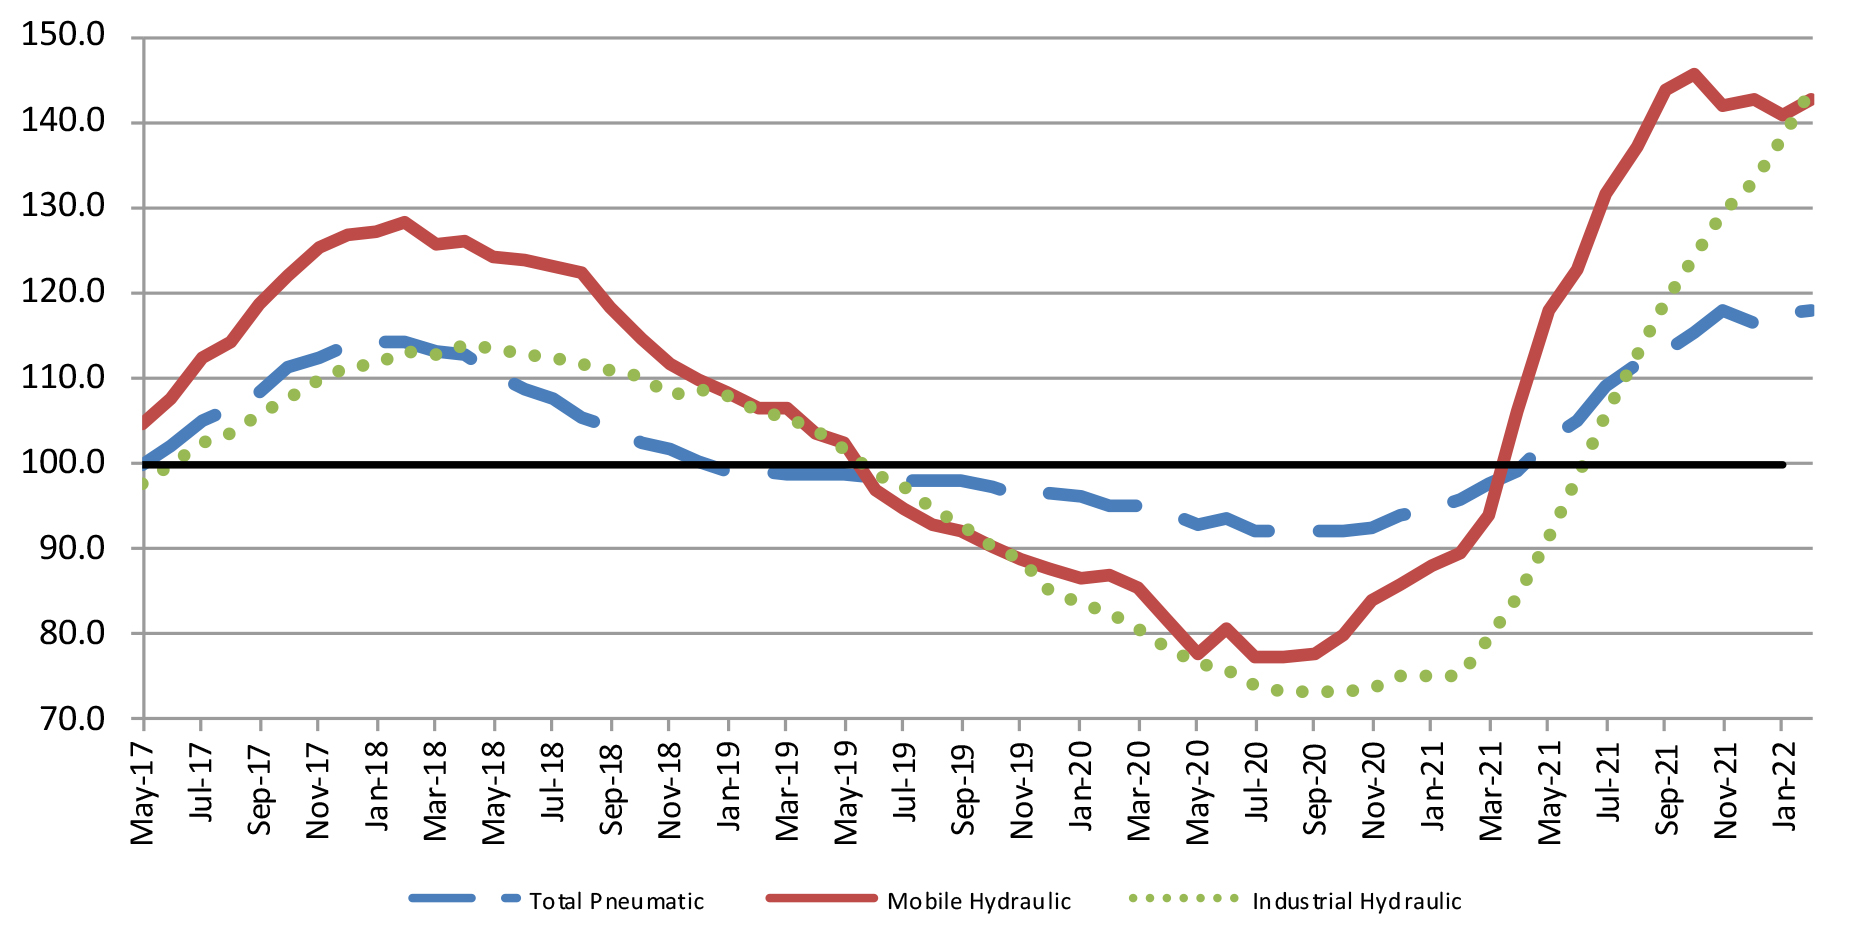
Each point on this graph represents the most recent 12 months of orders compared to the previous 12 months of orders. Each point can be read as a percentage. For example, 141.3 (the March 2022 level of the industrial hydraulic series) indicates that industrial hydraulic orders received from April 2021 to March 2022 were 141.3% of the orders received from April 2020 to March 2021. (Base Year 2018 = 100)
Total Hydraulic and Pneumatic Shipments 12-Month Moving Average
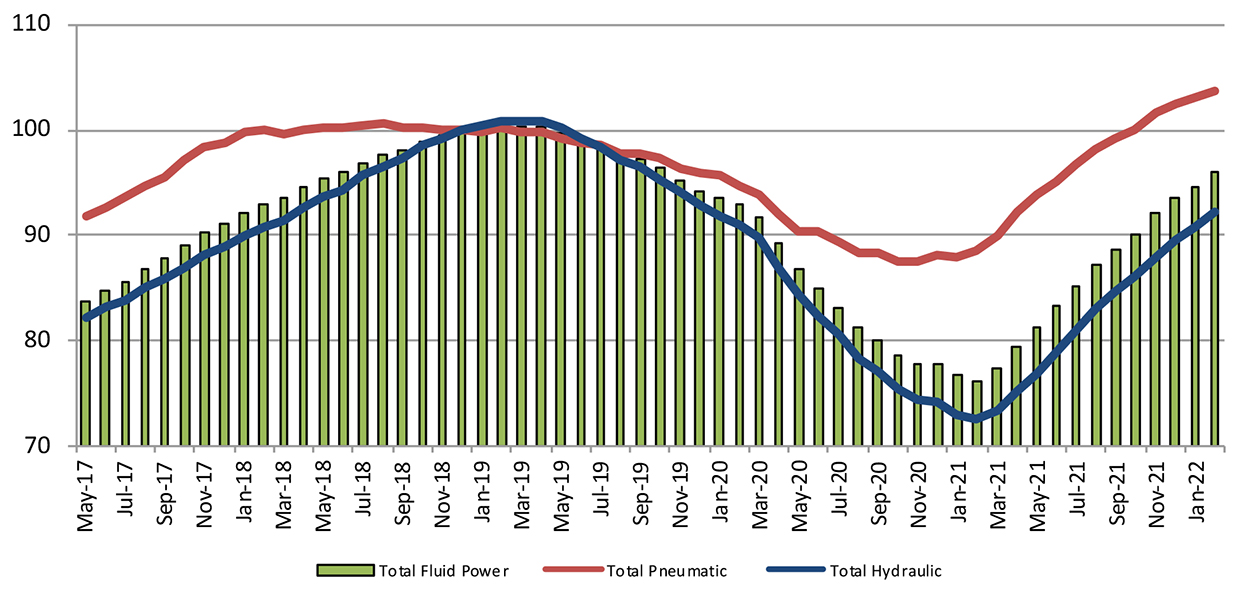 This graph of 12-month moving averages shows that in March 2022, the moving average for shipments continued to increase across the board. (Base Year 2018 = 100)
Shipments – Cumulative year‐to‐date % change (2021 vs. 2020)
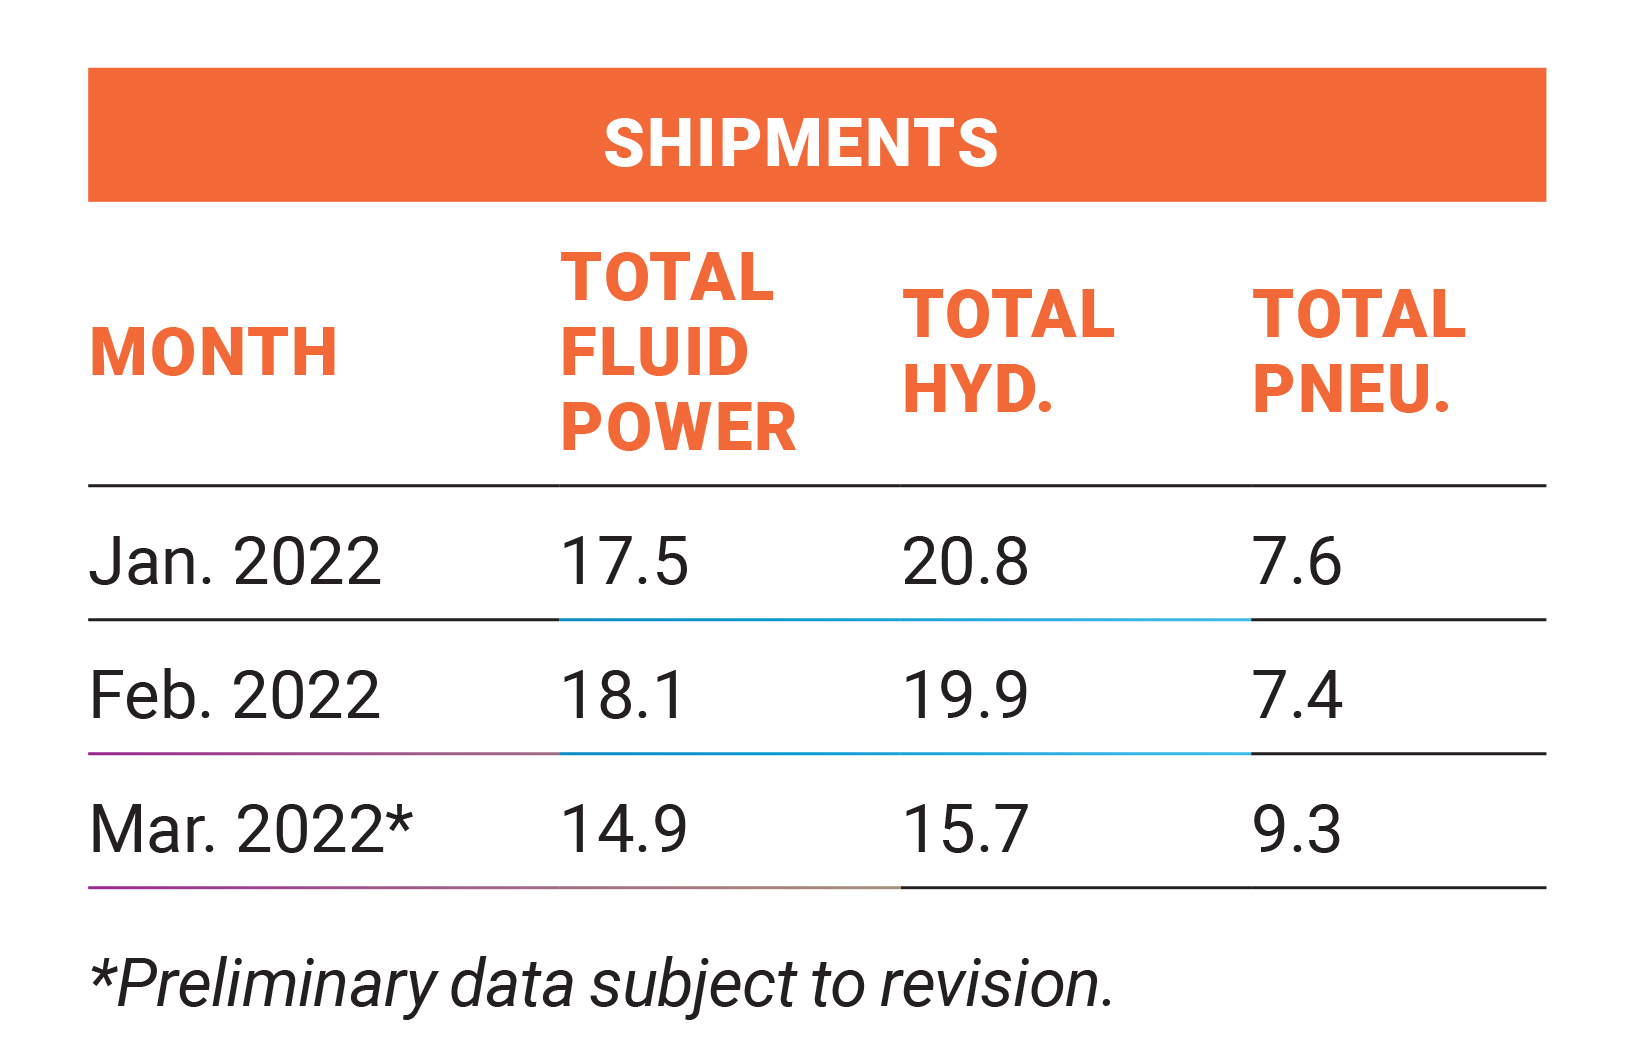 The table above is expressed in terms of cumulative percent changes. These changes refer to the percent difference between the relevant cumulative total for 2022 and the total for the same months in 2021. For example, March 2022 pneumatic shipments figure of 9.3 means that for the calendar year through March 2022, pneumatic shipments increased 9.3% compared to the same time-period in 2021.
Share this information.
Related Posts


Sponsor
Sponsors