Growth Reported in January Shipments
Fluid power shipments grew in January, according to data from the National Fluid Power Association. Raw index data shows that pneumatic, mobile hydraulic, and industrial hydraulic shipments all increased in January when compared to December. The year-to-date percent change for total fluid power shipments in January 2023 was 21.1%, up from 16.6% in December. For total hydraulic shipments, the change was 24.6%, up from December’s 20.1%. The change in total pneumatic shipments was 15.1 in January, up from 8.5 in December. Mobile hydraulic orders received from February 2022 to January 2023 are currently 102.3% of the orders received from February 2021 to January 2022.
Hydraulic and Pneumatic Shipments
Raw Index Data, Index: 2018=100
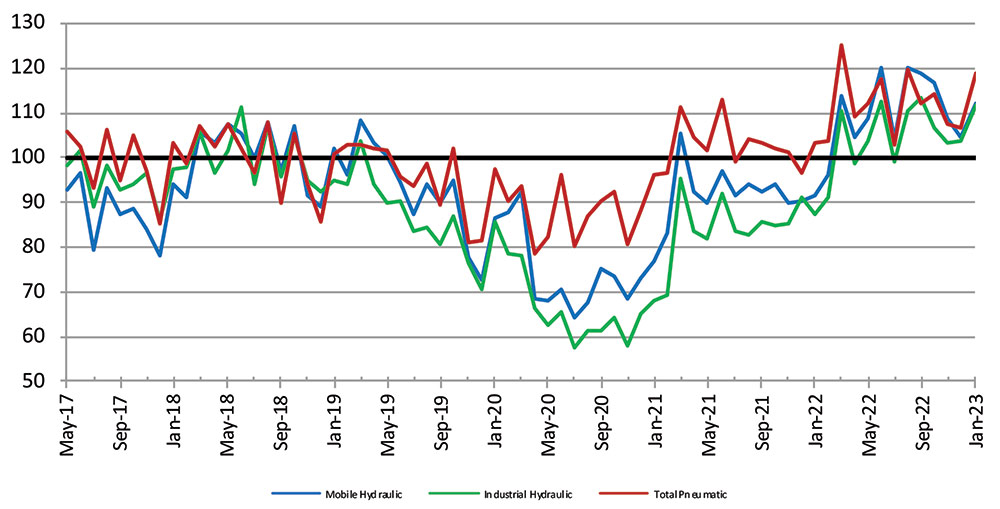
This graph of raw index data is generated by the total dollar volume reported to NFPA by CSS participants and compared to the average monthly dollar volume in 2018. For example, the January 2023 total dollar volume for pneumatic shipments is 118.9% of the average monthly dollar volume in 2018. (Base Year 2018 = 100)
Pneumatic, Mobile, and Industrial Hydraulic Orders 12/12 Ratio
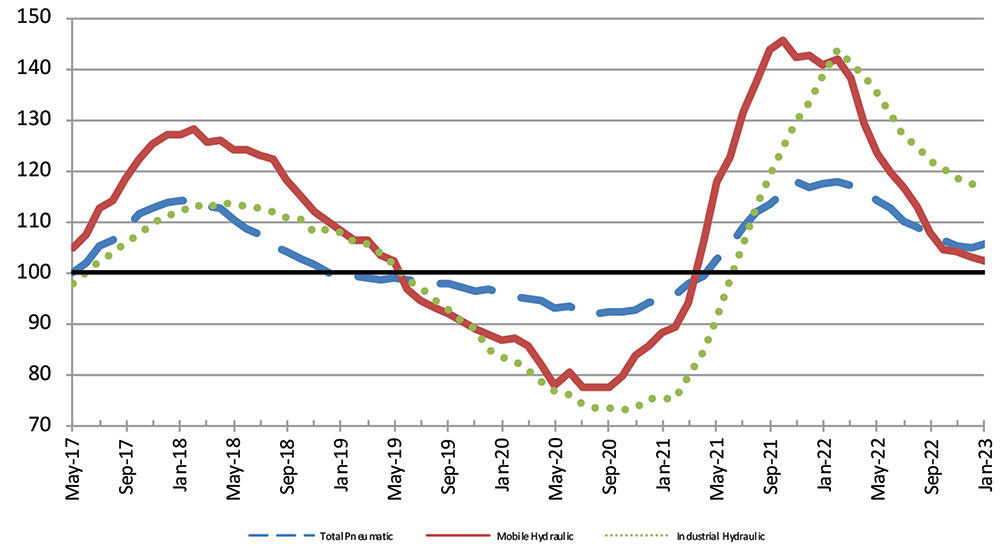
Each point on this graph represents the most recent 12 months of orders compared to the previous 12 months of orders. Each point can be read as a percentage. For example, 116.0 (the January 2023 level of the industrial hydraulic series) indicates that industrial hydraulic orders received from February 2022 to January 2023 were 116.0% of the orders received from February 2021 to January 2022. (Base Year 2018 =100)
Total – Hydraulic and Pneumatic Shipments 12 Month Moving Average
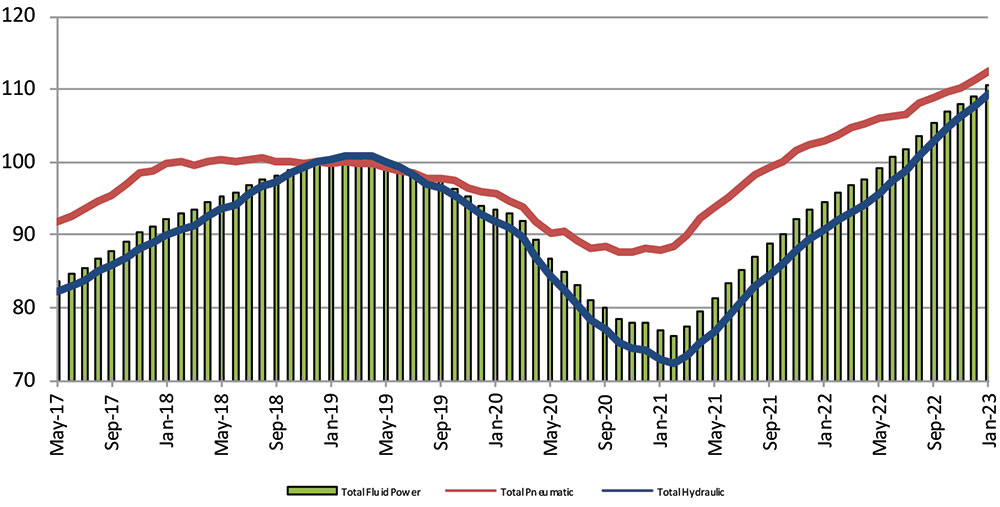
This graph of 12-month moving averages shows that in January 2023, total fluid power, total pneumatic, and total hydraulic all increased. (Base Year 2018 = 100)
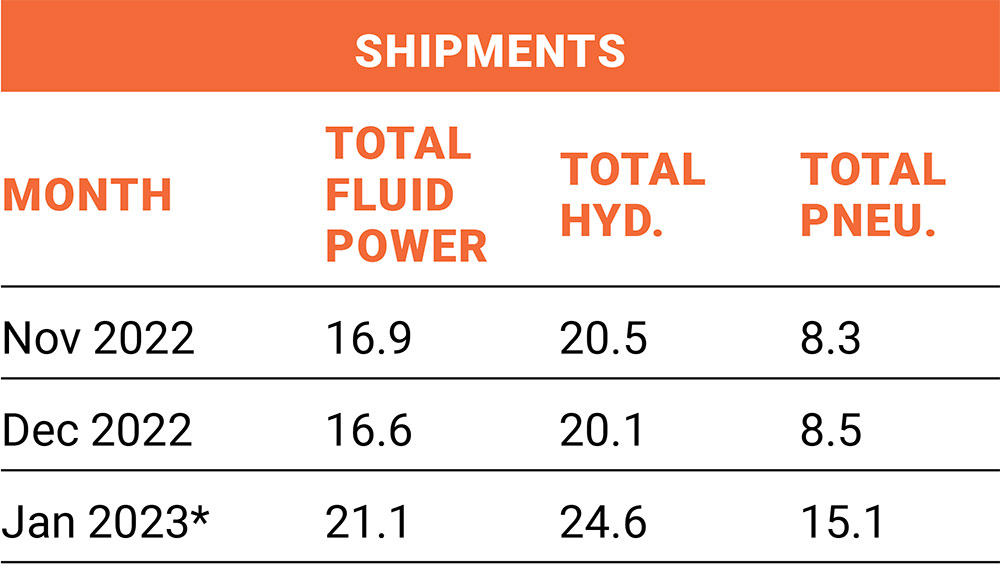
*Preliminary data subject to revision.
Shipments – Cumulative year‐to‐date % change (2023 vs. 2022)
The table above is expressed in terms of cumulative percent changes. These changes refer to the percent difference between the relevant cumulative total for 2023 and the total for the same months in 2022. For example, January 2023 pneumatic shipments figure of 15.1 means that for the calendar year through January 2023, pneumatic shipments increased 15.1% compared to the same time-period in 2022.
Share this information.
Related Posts

Motion Names Senior VP

Nomination of Frederic MICHELLAND as CEO Chief Executive Officer of Poclain Group

Without Skilled Tradespeople, Who Builds It?
Concept Machine Tool Named Distributor for Six Midwest States
Linde Hydraulics Introduces New Valve Block

25 Years of Growth and Innovation at Schmalz Inc. in Raleigh, NC
Sponsor

Sponsors