November Fluid Power Shipments Down
Fluid power shipments dropped in November, according to data from the National Fluid Power Association. Raw index data shows that pneumatic, mobile hydraulic, and industrial hydraulic shipments all decreased in November when compared to October. The year-to-date percent change for total fluid power shipments in November was 16.9%, down from 17.6% in October. The 12-month moving average of shipments for pneumatics, hydraulics, and total fluid power continues to grow. Mobile hydraulic orders received from December 2021 to November 2022 are currently 104.2% of the orders received from December 2020 to November 2021. The following charts are drawn from NFPA’s Confidential Shipment Statistics (CSS) program.
Hydraulic and Pneumatic Shipments
Raw Index Data, Index: 2018=100
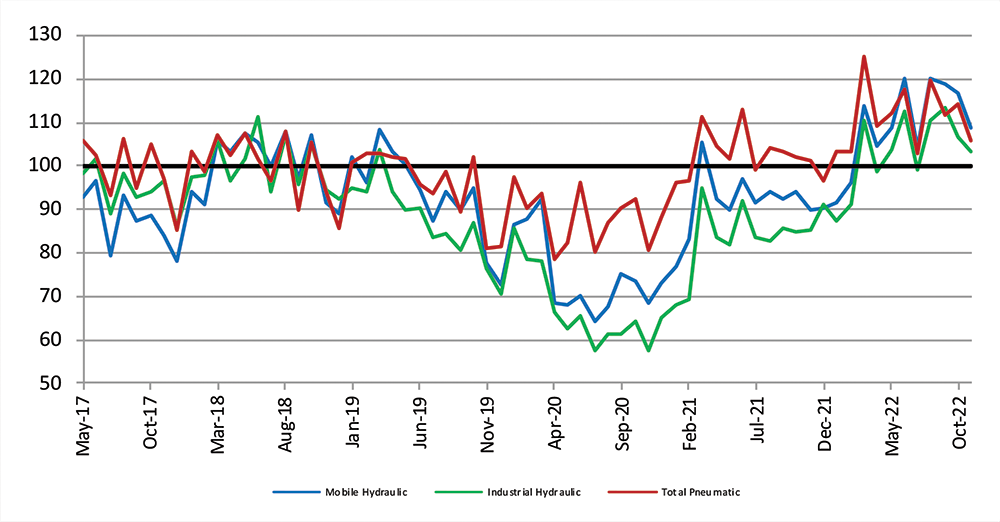
This graph of raw index data is generated by the total dollar volume reported to NFPA by CSS participants and compared to the average monthly dollar volume in 2018. For example, the November 2022 total dollar volume for pneumatic shipments is 105.9% of the average monthly dollar volume in 2018. (Base Year 2018 = 100)
Pneumatic, Mobile, and Industrial Hydraulic Orders 12/12 Ratio
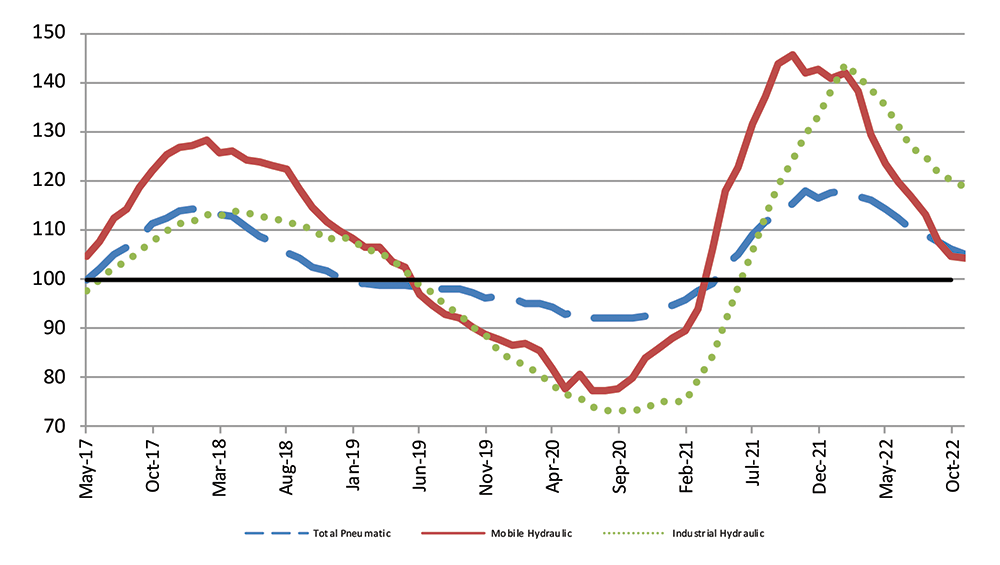
Each point on this graph represents the most recent 12 months of orders compared to the previous 12 months of orders. Each point can be read as a percentage. For example, 118.5 (the November 2022 level of the industrial hydraulic series) indicates that industrial hydraulic orders received from December 2021 to November 2022 were 118.5% of the orders received from December 2020 to November 2021. (Base Year 2018 = 100)
Total – Hydraulic and Pneumatic Shipments 12 Month Moving Average
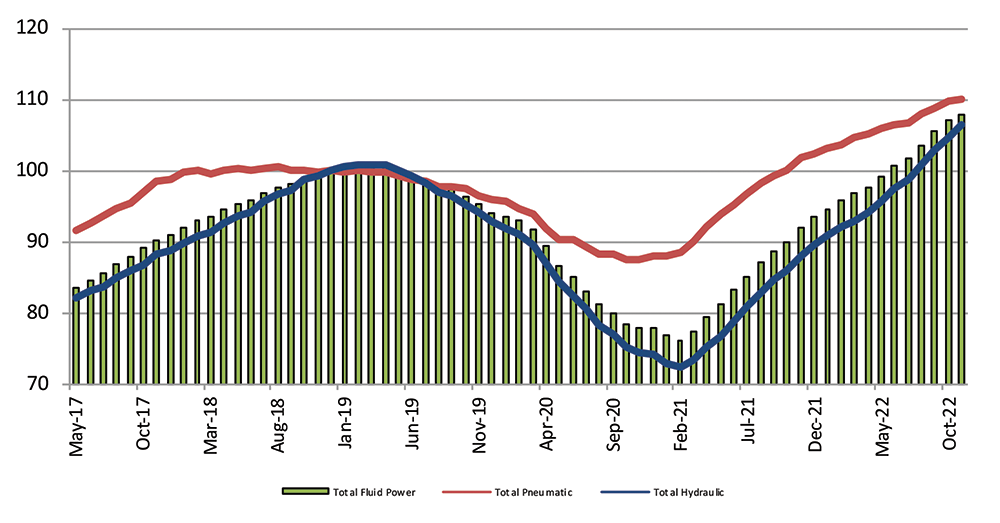
This graph of 12-month moving averages shows that in November 2022, total fluid power, total pneumatic, and total hydraulic all increased. (Base Year 2018 = 100)
Shipments – Cumulative year‐to‐date % change (2022 vs. 2021)

The table above is expressed in terms of cumulative percent changes. These changes refer to the percent difference between the relevant cumulative total for 2022 and the total for the same months in 2021. For example, November 2022 pneumatic shipments figure of 8.2 means that for the calendar year through November 2022, pneumatic shipments increased 8.2% compared to the same time-period in 2021.
Share this information.
Related Posts

Smart & Sustainable Monitoring Solutions for Pneumatically-Driven Machines

Air Hydro Power Acquires Huntington Hose and Hydraulics

PIRTEK Announces New Franchises

Shipments, Exports Down in 2020 Due to Pandemic

Manufacturing PMI® at 47.4%; December 2023 Manufacturing ISM® Report On Business®

Registration Opens for NFPA Annual Conference
Sponsor
Sponsors