Shipments Down in September
Some fluid power segments saw decreased shipments in September, according to data from the National Fluid Power Association. Raw index data showed that pneumatic and mobile hydraulic shipments decreased while industrial hydraulic shipments increased in September when compared to August. The year-to-date percent change for total fluid power shipments in September was 17.2%, up from 16.4% in August. The 12-month moving average of shipments for pneumatics, hydraulics, and total fluid power continues to grow. The data is from NFPA’s Confidential Shipment Statistics (CSS) program.
Hydraulic and Pneumatic Shipments
Raw Index Data, Index: 2018=100
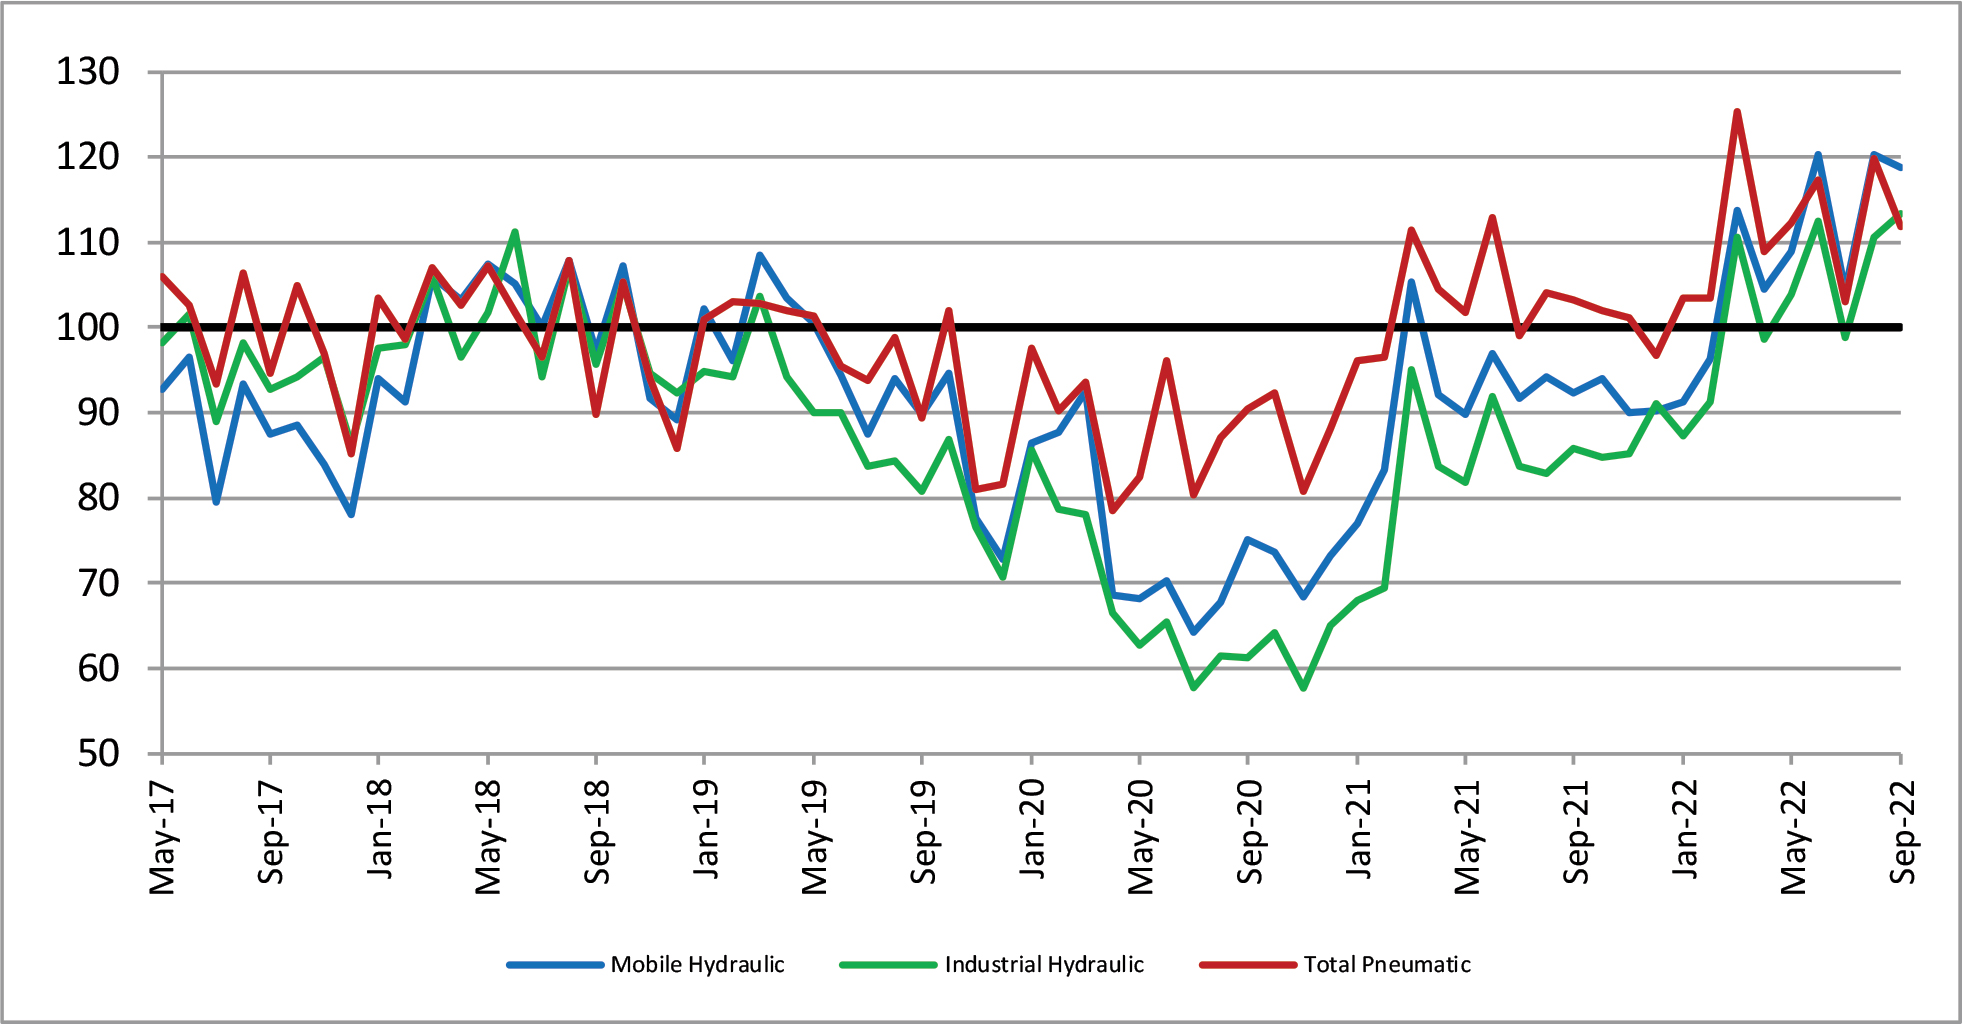
This graph of raw index data is generated by the total dollar volume reported to NFPA by CSS participants and compared to the average monthly dollar volume in 2018. For example, the September 2022 total dollar volume for pneumatic shipments is 111.9% of the average monthly dollar volume in 2018. (Base Year 2018 = 100)
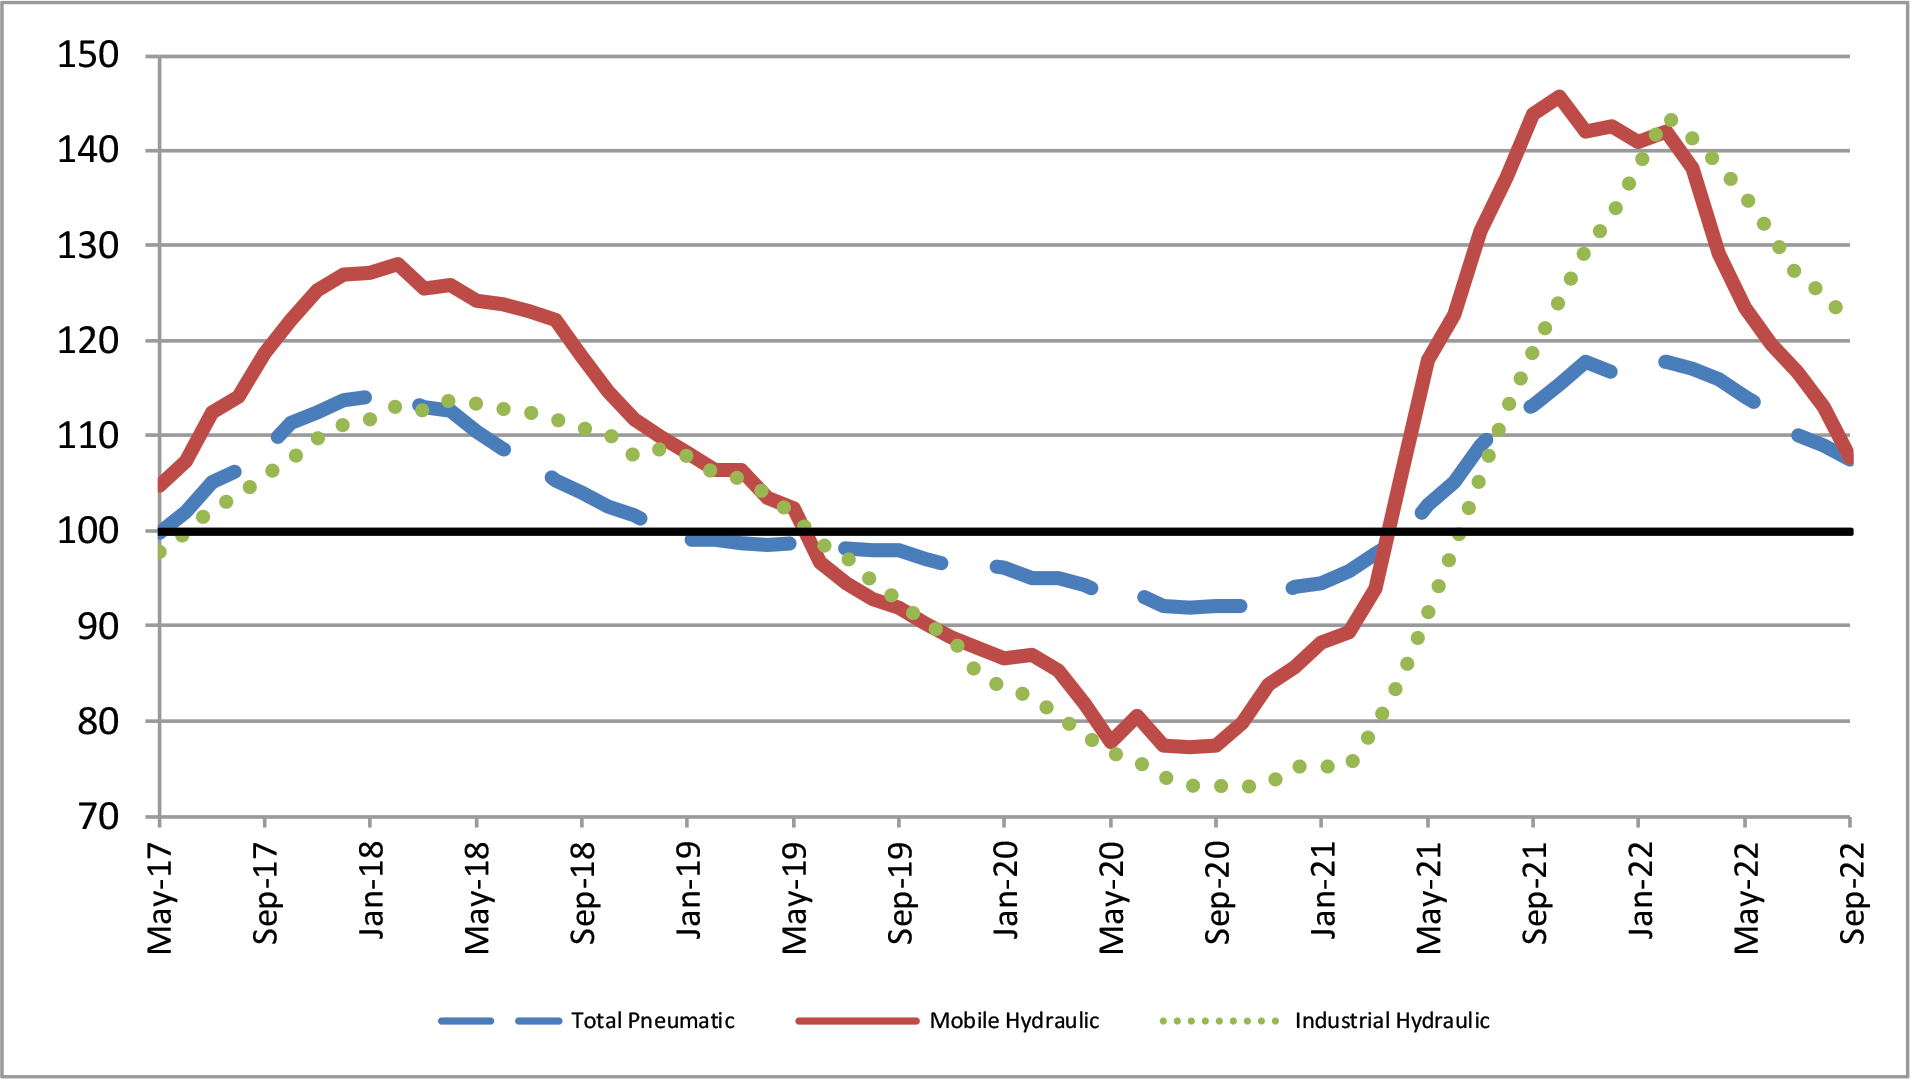
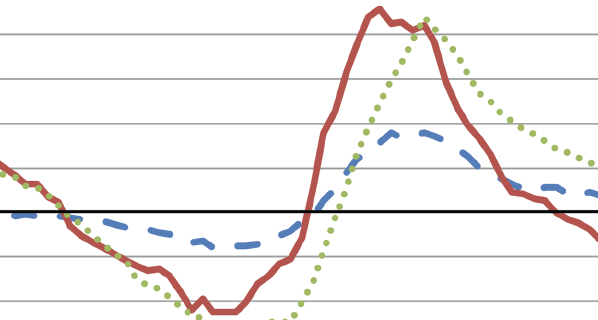
Pneumatic, Mobile and Industrial Hydraulic Orders 12/12 Ratio
Each point on this graph represents the most recent 12 months of orders compared to the previous 12 months of orders. Each point can be read as a percentage. For example, 121.8 (the September 2022 level of the industrial hydraulic series) indicates that industrial hydraulic orders received from October 2021 to September 2022 were 121.8 % of the orders received from October 2020 to September 2021. (Base Year 2018 = 100)
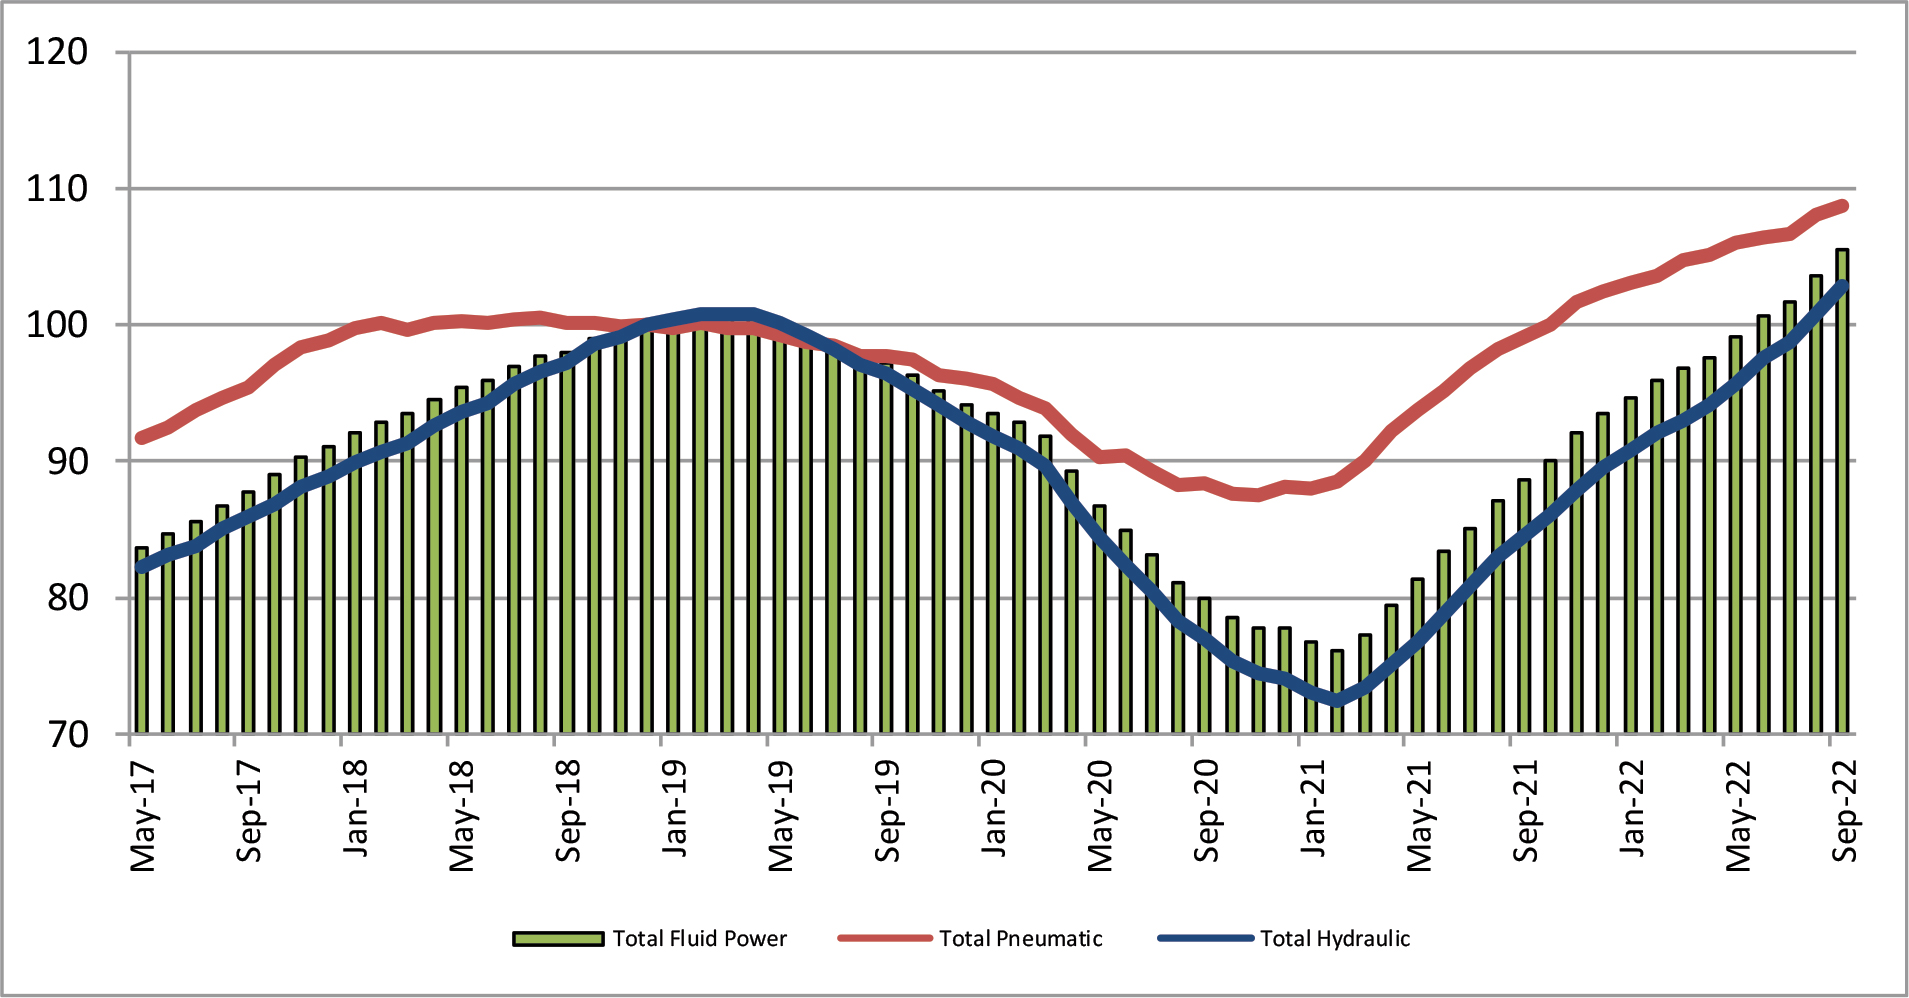
Total ‐ Hydraulic and Pneumatic Shipments
12 Month Moving Average
This graph of 12-month moving averages shows that in September 2022, total fluid power, total pneumatic, and total hydraulic all increased. (Base Year 2018 = 100)
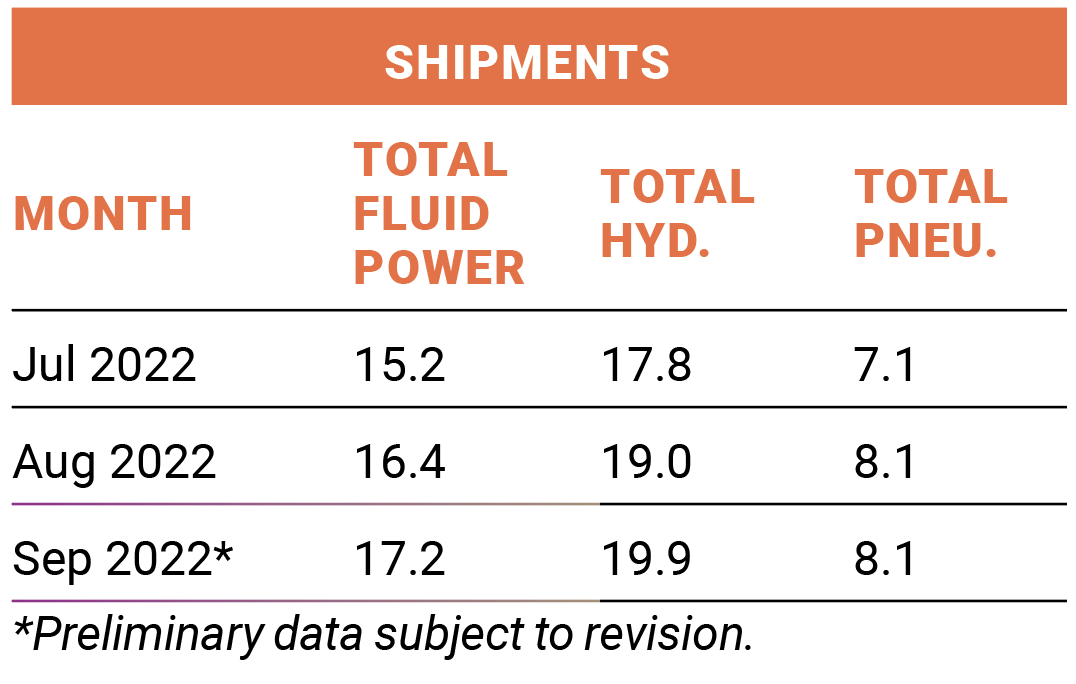
Shipments – Cumulative year‐to‐date % change (2022 vs. 2021)
The table above is expressed in terms of cumulative percent changes. These changes refer to the percent difference between the relevant cumulative total for 2022 and the total for the same months in 2021. For example, September 2022 pneumatic shipments figure of 8.1 means that for the calendar year through September 2022, pneumatic shipments increased 8.1% compared to the same time-period in 2021.
Share this information.
Related Posts

Trelleborg Announces Leadership Changes

Exair Releases Conveyors for Corrosive Environments

Cleanova Expands Global Footprint with Acquisition of Sidco Filter Company and Shawndra Products
Fluid Power Industry Growth Trend
Bosch Rexroth is Opening New Hydraulics Training Center, Investing in Hydraulics Education

Motion Industries Rebrands
Sponsor
Sponsors