Measuring a Sensor’s Linearity Error
By Edward E. Herceg, Vice President and Chief Technology Officer, Alliance Sensors Group
Most analog output sensors have general specifications such as linearity (or non-linearity), repeatability, and resolution, as well as environmental specifications like operating temperature or shock and vibration, and dynamic specifications like response or bandwidth. All of these specifications represent limits of error or sources of uncertainty related to the sensor’s output compared to its input. Many of these terms are fairly easy to understand by their wording alone, but linearity error or nonlinearity is not in that category.
Linearity, or more correctly, non-linearity, is a measure of the maximum deviation of the output of any sensor from a specified straight line applied to the plot of the data points of the sensor’s analog output versus the input parameter being sensed, which is called the measurand, under constant environmental conditions. The more linear the sensor’s output, the easier it is to calibrate and minimize uncertainty in its output scaling. However, understanding a sensor’s non-linearity specification requires understanding the nature of the reference straight line.
There are several possible reference straight lines that could express a sensor’s linearity error. The optimum choice based on statistics would be a best-fit line. But what is the criterion for best fit? Both experience and statistics favor a line calculated by the method of least squares, whereby the sum of the squares of the deviations from the desired line is mathematically minimized. Such a best-fit straight line (BFSL) is broadly used as a basis for a sensor’s linearity error or non-linearity, not merely because it is statistically appropriate but also because it has been validated in real world measurements.
Impact of Other Errors
Because the linearity error applies to the analog output of the sensing system, recognition must be given to other errors that can affect the output besides sensor non-linearity. To fully comprehend what the linearity error specification actually means, there are several preconditions that must apply to the measurement process. First, environmental factors like ambient temperature must be reasonably constant or small changes compared to the linearity error. Next, the repeatability and hysteresis errors in the sensor itself must also be small compared to its linearity error. Third, any non-linearity in the system output caused by ancillary electronics in the measuring system must also be very small compared to a sensor’s linearity error. Finally, the resolution of both the sensor and the output reading instrument must be sufficient to react to the small deviations in output caused by linearity error.
Measurement errors cannot simply be added together arithmetically but are correctly combined by a root-sum-squares calculation. So only if these other errors are small will linearity error be the dominant source of measurement uncertainty. Otherwise, the weighting effect of the other errors can lead to serious uncertainties about the measurement results. This is also one of the reasons that trying to measure linearity error is more complicated than it might seem. Not only must there be the ability to minimize the effects of ambient factors like temperature and humidity, but it is important to note that sensor linearity error needs to be measured with equipment having at least ten times the desired precision of the linearity error itself, which usually means highly precise equipment normally found only in metrological calibration or national standards laboratories.
Specifying Linearity Error
The maximum linearity error using a BFSL reference for a unipolar output sensor is usually expressed as a (±) percentage of full scale output, also called or full span output (FSO). For a bipolar output sensor, its maximum linearity error is expressed as a (±) percentage of full range output (FRO), i.e., from (-) FSO to (+) FSO.
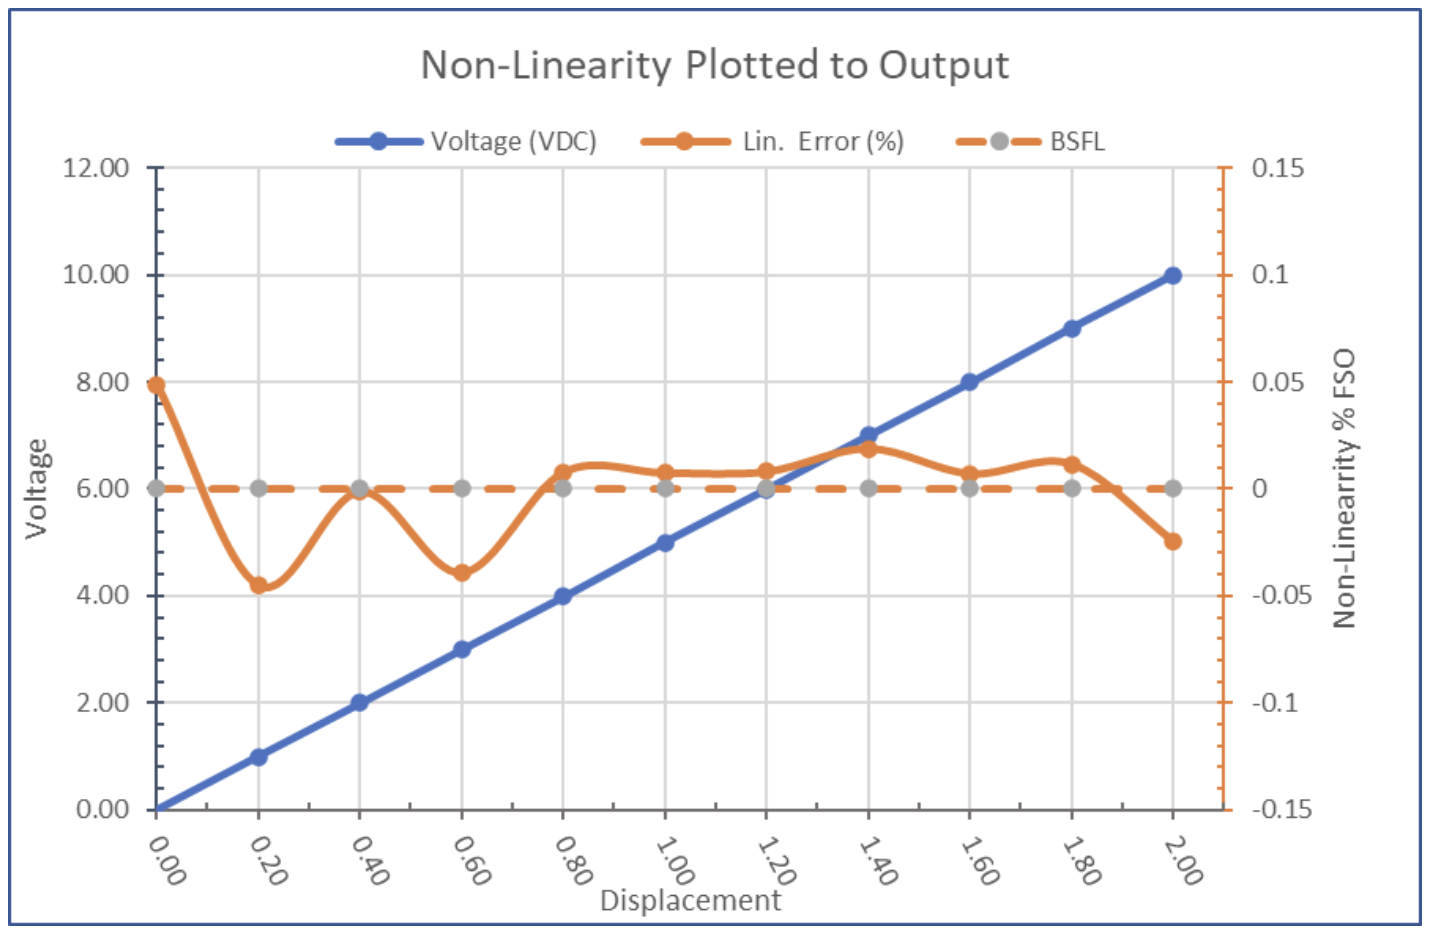
To illustrate the effects of linearity error, consider a sensor with a range of 0 to 2 inches, an output of 0 to 10 V DC, and its linearity error specified as ±0.25% of FSO. The sensor has a scale factor of 5 volts per inch and an FSO of 10 V DC, so non-linearity could cause an error of ±25 mV in the output, which is equivalent to an error of ±0.005 inches. The user must then decide whether this level of error is tolerable. This is illustrated in the graph below, which shows both the sensor’s analog output in blue and its point-by-point error from the reference line in orange. Keep in mind that the units of the error are so much smaller than the unit of output that, if shown along the blue line, they would be indiscernible in terms of resolution.
To summarize:
- Linearity error is referenced to a best-fit straight line calculated by the least squares method.
- Low sensor linearity error increases measurement precision and facilitates system calibration.
- Errors due to temperature, repeatibility, hysteresis, and resolution could affect output linearity.
- Sensor errors do not simply add up but must be combined by a root-sum-squares calculation.
- A sensor’s calibration equipment must be a minimum of ten times better than the measurement precision desired.
Share this information.
Related Posts

Signs of the Times: Expanding Hydraulic Hose Performance Metrics

Margin of Safety: Bucher Adds Load-Control Valves
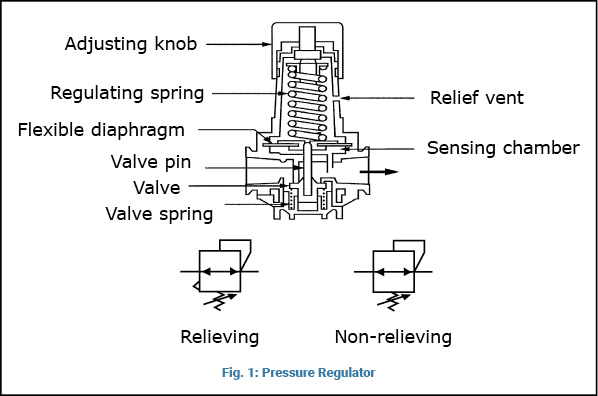
Understanding The Characteristics of Pressure Regulators
Automated Unloading with the Right Gripper Concept

Feds Warn of Cyber Threats to Manufacturers
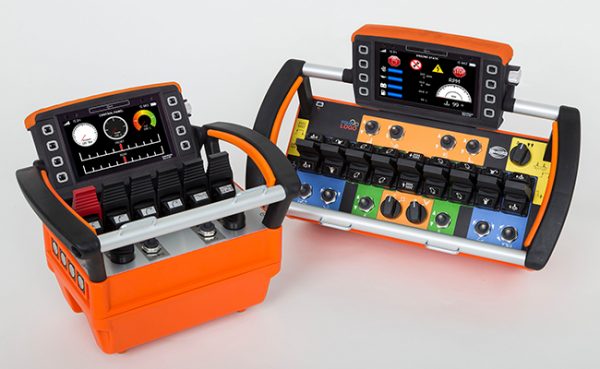
HBC-radiomatic Exhibits New Remote Controls at Utility Expo
Sponsor

Sponsors