Sonic Conductance for Everyone
(Or Why You Should Consider Moving Away From the Cv Flow Standard in Pneumatics)
Let us start by having a closer look at Cv (ANSI T3.21.3) and the implications we encounter when using this standard to determine the size of a pneumatic valve. Coefficient of flow, or simply Cv, is a standard applied to determine the flow capacity of components using water as the test fluid. It also defines a pressure drop of 1 psi (1-2%) across the test object. To eventually get an airflow rate (Q), it is necessary to apply a conversion factor. Based on its inherent properties, it is apparent that this method will not provide an accurate result. In particular, the low-pressure drop is a problem, since pneumatic circuits frequently operate with a pressure drop across the valve seat up to 15% of the inlet pressure. I know there have been countless valves selected based on the Cv data, and they probably worked just fine. The truth is, there are critical applications out there that require a more refined selection procedure, rather than chronically over-sizing components “just to be on the safe side.” When it comes to sizing, I like to say: “As small as possible and as big as necessary!” This also makes sense from an economical and ecological point of view.
Sonic Conductance as defined by ISO 6358, released in 1989, uses two key parameters: (1) sonic conductance [C], which I will refer to as C-Value, and (2) critical pressure ratio [b], which I will call b-Value.
- C-Value is the maximum flow capacity of any pneumatic component with an open flow path including plumbing, directional, and flow control valves. A pneumatic component has reached its maximum flow rate when the medium passing through reaches sonic flow condition. This is also referred to choked flow. The unit used is dm3/s*bar (liters per second per bar).
- b-Value is the critical pressure ratio between the output and input pressure when the flow condition changes from subsonic to sonic, or vice versa. In other words, it is exactly the point where the pneumatic component has reached its maximum flow capacity. There is no unit for b-Value, since it is a ratio.
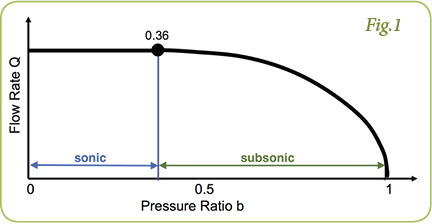
Let’s examine a typical flow curve in relation to pressure, as shown in Fig. 1. You will notice the straight horizontal line on the left side of the graph. This represents the maximum flow rate of the test component. Right when this line starts to fall, we enter the subsonic flow condition. This point is the critical pressure ratio b. As the pressure ratio increases, the flow rate decreases. When we reach a pressure ratio of 1, flow has stopped (e.g., an actuator reaching its end position).
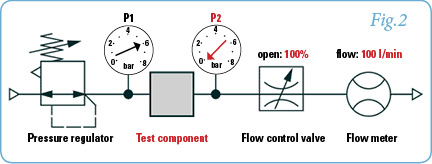
With the help of Fig. 2, which represents the simplified setup of ISO 6358, it will be easy to comprehend the concept. To begin, compressed air is supplied to a pressure regulator set to 6 bar (87 psi). The compressed air flows through the test component. On the downstream side of the test component, we monitor the output pressure. As the test begins, the flow control valve is fully open (no back pressure), so we achieve maximum flow. The flow rate is measured by the flow meter, shown in our example as 100 l/min.
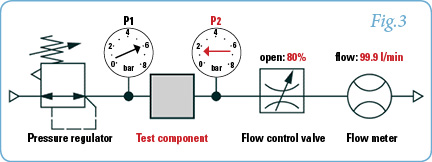
Next we start to close our flow control valve. We will continue until we observe the flow rate dropping. In Fig. 3, with an 80% open flow control valve, we can now see that P2 has increased to 1.5 bar and the flow has just started to decline to 99.9 l/min. This is where we get the b-Value. Simply divide P2abs by P1abs [(1.5+1)/(6+1) = 0.36]. That means this test component has a rated b-Value of 0.36. Any pressure ratio below 0.36 indicates a sonic flow condition, and any ratio higher than 0.36 implies a subsonic flow condition. In order to plot the graph, we continue to reduce the flow by continuing to close the flow control valve. On the way to a fully closed flow control valve, we collect P1 and P2 data and calculate pressure ratios accordingly, just as we did before. When the flow control valve is fully closed, supply pressure and output pressure will be equal; hence, the pressure ratio will be 1 with no flow occurring.
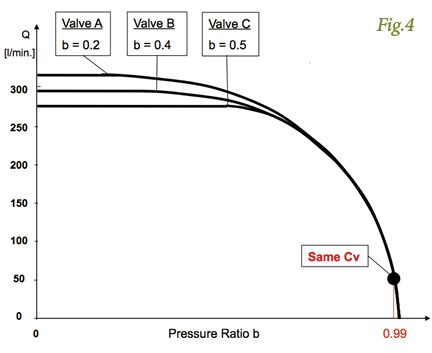
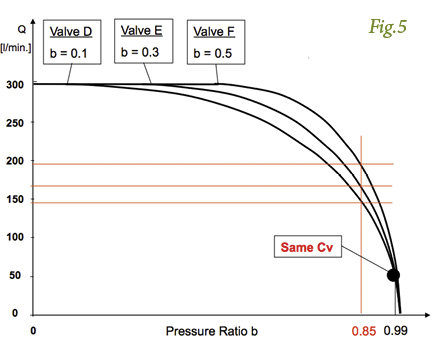
I had mentioned earlier that Cv is obtained at a pressure drop of 1 psi. If we assume a supply pressure P1 of 100 psiabs and a pressure drop of 1 psi, this would give us a P2 pressure of 99 psiabs. If we calculate the pressure ratio, we will get 0.99. I also mentioned that a 15% pressure drop across a valve is very typical for a standard pneumatic application. A 15% drop equals a pressure ratio of 0.85. If we look at Figs. 4 and 5, the problem suddenly becomes very clear. Fig. 4 shows three valves with the same Cv, but different b-Values and different maximum flow rates. Fig. 5 shows three valves with identical Cv, but different b-Values resulting in the different gradient of the flow curve. Since Cv is based on a single data point in the flow curve, it cannot provide reliable data for the remaining course of the curve. On the other hand, however, with the use of C- and b-Values, it is possible to obtain an accurate flow rate at any given pressure ratio, including the ratio when the flow enters the sonic or subsonic flow condition respectively. ISO 6358 accounts for the inner design and construction of the flow path of a pneumatic component, where Cv cannot.
Now, how do we use those values to get the flow rate? I will show the scientific way and the easy way.
1. Scientific way:
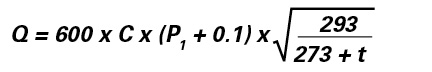
1.1 Maximum flow rate in sonic condition (choked flow)
1.2 Subsonic flow rate (normal operation)
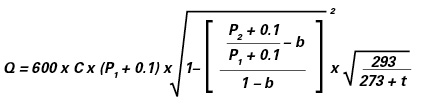
Q = flow rate [l/min]
C = C-Value [dm3/s*bar]
P1 = Supply pressure [MPa]
P2 = Output pressure [MPa]
b = b-Value [-]
t = Temperature [°C]
2. Let us quickly move on to the easy way before we get a headache from those formulas.
2.1 Most valve selections will be done for standard applications with the mentioned 15% pressure drop. See the chart in Fig. 6 to quickly get the flow rate. All you need to do is locate the C- and b-Values of the valve you think might work. Take the b-value of the valve you pre-selected to the chart and get the multiplier based on your system pressure. Multiply the number you obtained from the chart by the C-Value of the valve you pre-selected.
Note: the chart is based on a 15% pressure drop and a standard air temperature of 20°C (68°F).
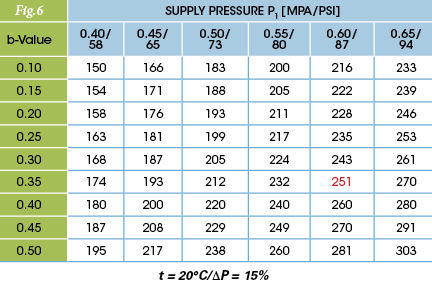
Example:
C-Value: 0.8
b-Value: 0.35
System pressure: 0.6 MPa (87 psi)
Multiplier from the chart: 251
Flow rate Q = 251 x 0.8 = 200 l/min
2.2 If you quickly want to know the maximum flow capacity (sonic flow) of a valve, multiply the C-Value by 420.
Note: 420 is based on a system pressure of 0.6 MPa (87 psi) and a standard air temperature of 20°C (68°F).
We have learned now that this standard has huge benefits. It allows you to determine the exact flow rate of a pneumatic component at any given differential pressure between input and output. It gives you the maximum flow capacity of the component and tells you at what pressure ratio this happens. Furthermore, with most major pneumatic equipment manufacturers providing the relevant data, it is possible to find the most suitable component for the application.
So the next time you open up a valve specification data sheet, I hope this article encourages you to specifically look for sonic conductance C and critical pressure ratio b.
Share this information.
Related Posts


2 thoughts on “Sonic Conductance for Everyone”
Leave a Reply
Sponsor

Sponsors
Is C value is Cv ? Correct
Please inform me ?
Then Sonic Conductance C [dm3/(s·bar)] = C *0.219512195 = Cv
You see we are in America and we use Imperial units not metric units. What has worked for hundreds of years will work for this as well. We cannot buy a compressor based on Sonic Conductance, we buy them using SCFM at a certain pressure.